Hold onto your hats, crypto enthusiasts! Render (RNDR) has been on a rollercoaster ride. After an exhilarating week-long bull run that saw prices skyrocket nearly 20%, the AI token pump seemingly hit the brakes on May 11th. If you’re an RNDR investor, or just watching the crypto markets with keen interest, you’re probably asking the same question as everyone else: Is this the end of the RNDR surge, or just a breather before another leap upwards?
Why Did RNDR’s Bull Run Take a Break?
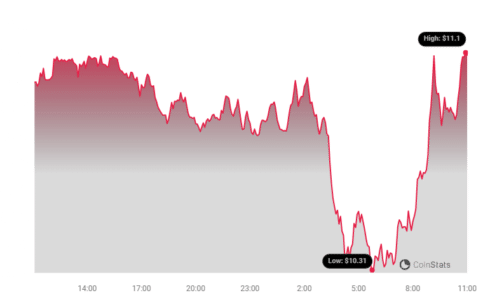
Let’s rewind a bit. RNDR, the token powering the decentralized GPU rendering network, had investors cheering as its price soared. However, as the broader crypto market showed signs of cooling down, RNDR also experienced increased selling pressure. But don’t write off the bulls just yet! Recent hours have shown hints of recovery, with RNDR’s price chart flashing green again. Currently trading around $10.90 with a robust market cap exceeding $4.2 billion, RNDR is still a force to be reckoned with.
To truly understand if RNDR is gearing up for another surge, we need to dive deeper into the metrics. Let’s analyze what the data tells us about this AI powerhouse.
Decoding the Metrics: What’s Behind RNDR’s Price Action?
Despite the impressive weekly rally, some key indicators suggest caution. Interestingly, Santiment data reveals a few potentially bearish signals:
- Social Volume Dip: Even during the price surge, social media buzz around RNDR actually decreased. This could indicate that the rally wasn’t fueled by widespread retail hype, which can sometimes be a sign of weaker long-term momentum.
- Negative Weighted Sentiment: On May 11th, market sentiment towards RNDR turned negative. This suggests that more investors were feeling bearish than bullish, potentially leading to increased selling pressure.
- Supply Shift to Exchanges: A significant amount of RNDR tokens moved onto exchanges last week, while the supply held outside of exchanges decreased. This is a classic sign of increased selling pressure, as investors typically move tokens to exchanges when they intend to sell.
- Top Holders Selling: Even the big players, the top addresses holding RNDR, slightly reduced their holdings. This could indicate that whales or institutional investors were taking profits, further contributing to selling pressure.
These metrics paint a picture of investors potentially viewing the recent price peak as a market top and deciding to take profits. But is it all doom and gloom for RNDR?
Is an AI Token Season on the Horizon? Hope for RNDR Bulls?
Not so fast, bears! Renowned crypto analyst Crypto Tony recently sparked optimism by tweeting about an anticipated “AI tokens season.” Could RNDR, a leading AI token, be poised to benefit from this trend?
AI season incoming 🤖 pic.twitter.com/a3211cMEid
— Crypto Tony (@CryptoTony__) May 16, 2024
Let’s examine RNDR’s daily chart for short-term clues:
- MACD Bullish Crossover: The Moving Average Convergence Divergence (MACD) indicator shows a bullish upper hand. This suggests potential positive momentum building in the short term.
- Price Above 20-day SMA: RNDR’s price comfortably sits above its 20-day Simple Moving Average (SMA). This is generally considered a bullish sign, indicating that the short-term trend is still upward.
Potential Roadblocks: Correction on the Horizon?
However, it’s crucial to acknowledge indicators suggesting a possible pullback:
- Bollinger Bands Upper Limit: RNDR’s price touched the upper band of the Bollinger Bands. Historically, this often precedes price corrections as assets become overbought.
- Chaikin Money Flow (CMF) Downtick: The CMF, which measures buying and selling pressure, has shown a sharp decline and is nearing the neutral mark. This signals weakening buying pressure and potential for further price drops.
The Verdict: RNDR at a Crossroads
RNDR’s current situation is a mixed bag. While some metrics point towards a potential continuation of the bull run, others suggest a possible price correction in the near term. The interplay between bullish indicators like the MACD and SMA, and bearish signals like Bollinger Bands and CMF, will likely determine RNDR’s next move.
For investors, this means navigating with caution. Keep a close watch on market sentiment, trading volumes, and broader crypto market trends. The potential for an AI token season, as highlighted by analysts, could indeed reignite RNDR’s surge. However, the existing bearish signals cannot be ignored.
Ultimately, whether RNDR resumes its bull run or faces a deeper correction remains to be seen. Stay tuned, crypto watchers, as the story of RNDR unfolds!
Disclaimer: The information provided is not trading advice. Bitcoinworld.co.in holds no liability for any investments made based on the information provided on this page. We strongly recommend independent research and/or consultation with a qualified professional before making any investment decisions.
#Binance #WRITE2EARN
Disclaimer: The information provided is not trading advice, Bitcoinworld.co.in holds no liability for any investments made based on the information provided on this page. We strongly recommend independent research and/or consultation with a qualified professional before making any investment decisions.