Is Solana (SOL) taking a breather or signaling a shift in momentum? After a remarkable week of gains, the popular cryptocurrency has experienced a slight pullback in the last 24 hours. Let’s dive into the latest Solana price movements, analyze the key trends, and see what these fluctuations might mean for investors.
Solana’s Price Performance: A Tale of Two Timeframes
In the past 24 hours, Solana’s price has seen a decrease of 3.33%, moving from $65.21 to $60.32. However, zooming out to a weekly view reveals a different picture. Over the last seven days, SOL has been on an upward trajectory, climbing 12.0% from $54.27 to its current levels. This recent dip comes after a significant weekly surge, prompting questions about the short-term and long-term outlook for Solana.
As of press time, Solana is trading at approximately $61.57. This real-time data offers a snapshot of the current market sentiment.

Decoding Solana’s Price Chart and Volatility
Visualizing price movements and volatility is crucial for understanding market dynamics. The charts below provide a comparative view of Solana’s price action over the past 24 hours (left) and the past week (right).
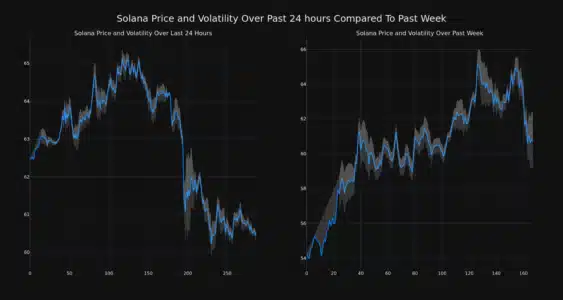
Notice the gray bands on the charts? These are Bollinger Bands, a popular technical analysis tool used to measure market volatility. Think of them as dynamic volatility indicators. Here’s a quick breakdown:
- What are Bollinger Bands? They consist of a middle band (usually a simple moving average) and two outer bands that widen and narrow based on price volatility.
- How to interpret them? Wider bands indicate higher volatility, meaning the price is fluctuating more dramatically. Narrower bands suggest lower volatility and more stable price movement.
- In Solana’s case: By observing the Bollinger Bands, you can visually assess whether Solana’s price swings are becoming more or less pronounced over both the daily and weekly periods.
See Also: Solana Decreases More Than 4% Within 24 hours
Trading Volume and Circulating Supply: Key Indicators
Beyond price and volatility, trading volume and circulating supply offer further insights into Solana’s market behavior.
Interestingly, Solana’s trading volume has surged by 76.0% over the past week. This significant increase suggests heightened market activity and investor interest in SOL. Typically, a rise in trading volume can accompany price movements, as more buying and selling occurs.
Conversely, the circulating supply of Solana has slightly decreased by 0.28% in the same period. Let’s break down why these metrics are important:
- Trading Volume: A higher trading volume often validates price trends. A price increase accompanied by high volume can indicate stronger bullish momentum.
- Circulating Supply: This refers to the number of SOL coins currently in circulation and available for trading. Changes in circulating supply can sometimes influence price, although in this case, the 0.28% decrease is relatively small and likely has a minimal immediate impact.

Currently, the circulating supply of SOL stands at 424.35 million coins. According to our data, Solana holds the #6 market cap ranking in the cryptocurrency world, with a market capitalization of $25.65 billion. This ranking underscores Solana’s position as a major player in the crypto space.
What Does This Mean for Solana Investors?
Solana’s recent price action presents a mixed bag. The 24-hour dip might cause short-term concern, but the robust weekly growth and increased trading volume paint a potentially bullish longer-term picture. Here are some key takeaways for investors:
- Short-Term Volatility: The daily price decrease highlights the inherent volatility of cryptocurrency markets. Be prepared for price swings, especially in the short term.
- Weekly Momentum: The 12% weekly uptrend suggests underlying strength and positive market sentiment towards Solana.
- Increased Trading Interest: The surge in trading volume indicates active participation and interest in SOL, which can be a positive sign.
- Market Position: Solana’s strong market cap ranking (#6) reinforces its status as a leading cryptocurrency.
Conclusion: Navigating Solana’s Price Fluctuations
Solana’s price movements are a reminder of the dynamic nature of the crypto market. While the recent 24-hour dip might be a point of caution, the strong weekly performance and increased trading volume offer reasons for optimism. As with any cryptocurrency investment, staying informed, understanding market trends, and conducting thorough research are crucial. Keep an eye on Solana’s price charts, monitor volatility indicators like Bollinger Bands, and stay updated on trading volume to make informed decisions in this exciting and ever-evolving market.
Disclaimer: The information provided is not trading advice. Bitcoinworld.co.in holds no liability for any investments made based on the information provided on this page. We strongly recommend independent research and/or consultation with a qualified professional before making any investment decisions.
Disclaimer: The information provided is not trading advice, Bitcoinworld.co.in holds no liability for any investments made based on the information provided on this page. We strongly recommend independent research and/or consultation with a qualified professional before making any investment decisions.