
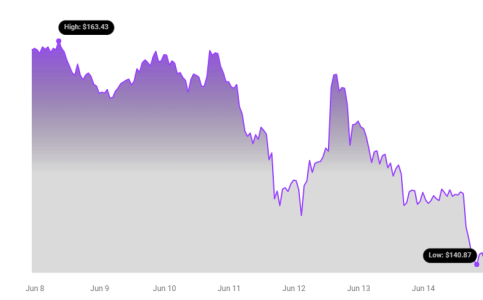
Hold onto your hats, crypto enthusiasts! The market is always on the move, and Solana (SOL) is currently experiencing a bit of a dip. Over the last 24 hours, the price of Solana has decreased by 5.0%, landing at $141.28. If you’ve been following SOL, you’ll know this isn’t happening in isolation. Zooming out to the past week, we see a continued downward trend of -12.0%, with the price sliding from $161.0 to where it stands now. Let’s dive into what’s behind this movement and what it could mean for Solana.
Decoding Solana’s Price Action: What’s Behind the Recent Dip?
To really understand what’s going on, we need to look at more than just the numbers. Charts can tell a story, and in Solana’s case, the story is about volatility and market dynamics. Take a look at the charts below:
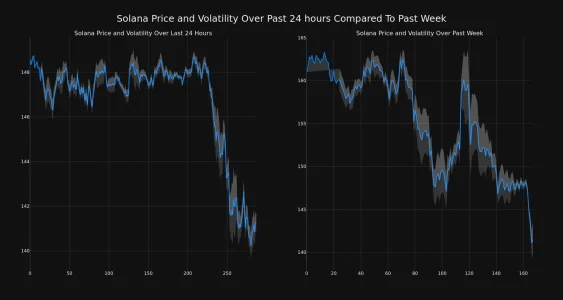
These charts compare Solana’s price fluctuations and volatility over two different timeframes: the last 24 hours (left) and the past week (right). Notice those gray bands? Those are Bollinger Bands, a handy tool used to measure volatility in the market. Think of them like this: the wider the bands, the bumpier the ride! A larger gray area signifies higher volatility, meaning the price is swinging more dramatically.
Key Takeaways from the Volatility Charts:
- Short-Term Volatility (24 Hours): The left chart shows the price movement and volatility within the last day. You can see how much the price has fluctuated within this shorter period.
- Weekly Volatility: The right chart gives a broader perspective, illustrating the price movement and volatility over the past week. This helps to identify trends and get a sense of the overall market sentiment towards Solana.
- Bollinger Bands in Action: The width of the gray Bollinger Bands visually represents the degree of price volatility. Wider bands indicate higher price swings, while narrower bands suggest lower volatility.
Trading Volume vs. Circulating Supply: A Diverging Path?
Interestingly, while the price and volatility are showing downward or fluctuating trends, another key metric, trading volume, is also painting a picture. The trading volume for Solana has actually decreased by 19.0% over the past week. This means fewer SOL tokens are being traded compared to the previous week.
Now, here’s where it gets a little more nuanced. While trading volume is down, the circulating supply of Solana has slightly increased by 0.26%. This might seem counterintuitive, so let’s break it down:
Understanding Trading Volume and Circulating Supply:
- Decreased Trading Volume (Down 19%): A drop in trading volume can sometimes indicate less interest in buying or selling a particular asset. It could be due to various factors, such as market uncertainty, profit-taking, or traders moving to other assets.
- Increased Circulating Supply (Up 0.26%): An increase in circulating supply means there are slightly more SOL tokens available in the market. This can happen through staking rewards, token unlocks, or other mechanisms defined by the Solana protocol.
What does this divergence mean? In simple terms, with less trading activity and a slightly increased supply, there could be more selling pressure than buying pressure, potentially contributing to the price decline. However, it’s important to note that this is just one piece of the puzzle.
Solana’s Market Position: Still a Top Contender
Despite the recent price drop, Solana remains a significant player in the crypto space. The circulating supply now stands at 461.66 million SOL tokens. According to the latest data, Solana holds the #5 market cap ranking, with a market capitalization of $65.13 billion. This solid market cap indicates strong overall investor confidence and the significant value attributed to the Solana network.
Solana’s Key Strengths:
- High-Performance Blockchain: Solana is known for its incredibly fast transaction speeds and low fees, making it a popular platform for decentralized applications (dApps) and DeFi projects.
- Growing Ecosystem: The Solana ecosystem continues to expand with new projects and partnerships, driving innovation and utility within the network.
- Strong Community: Solana boasts a vibrant and active community of developers and users, contributing to its ongoing development and adoption.
Is This a Buying Opportunity? Or Should You Be Cautious?
The million-dollar question! A price dip can sometimes present a buying opportunity for investors who believe in the long-term potential of an asset. However, it’s crucial to remember that the cryptocurrency market is inherently volatile and comes with risks.
Things to Consider:
- Market Sentiment: Overall market sentiment plays a huge role in crypto prices. Are we in a broader market downturn? Is there negative news affecting Solana specifically?
- Technical Analysis: Looking at technical indicators and chart patterns can provide further insights into potential price movements.
- Fundamental Analysis: Consider Solana’s fundamentals – its technology, adoption rate, development activity, and the strength of its ecosystem.
- Risk Tolerance: Assess your own risk tolerance and investment goals. Cryptocurrencies are high-risk, high-reward investments.
In Conclusion: Navigating the Solana Market
Solana’s recent 5% price drop in 24 hours, and the broader 12% decrease over the week, reflects the inherent volatility of the crypto market. While the price is down, it’s important to look beyond just the numbers. Factors like decreasing trading volume and a slight increase in circulating supply might be contributing to the current price action. However, Solana’s strong market cap ranking, its technological advantages, and its growing ecosystem suggest a robust underlying foundation.
Whether this dip represents a buying opportunity or a reason for caution depends on your individual investment strategy and risk assessment. Always conduct thorough research and consider consulting with a financial advisor before making any investment decisions in the cryptocurrency market.
Disclaimer: The information provided is not trading advice. Bitcoinworld.co.in holds no liability for any investments made based on the information provided on this page. We strongly recommend independent research and/or consultation with a qualified professional before making any investment decisions.
Disclaimer: The information provided is not trading advice, Bitcoinworld.co.in holds no liability for any investments made based on the information provided on this page. We strongly recommend independent research and/or consultation with a qualified professional before making any investment decisions.