

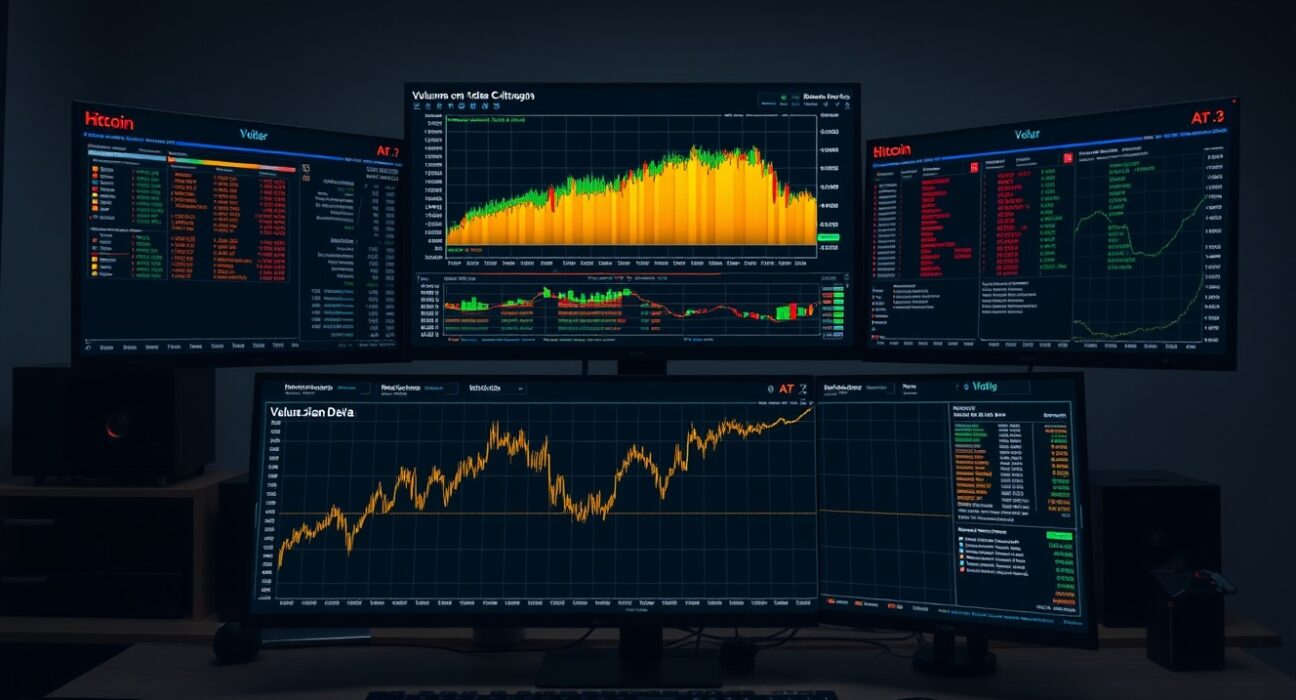
Traders preparing for the upcoming Spot CVD chart analysis on July 21 at 2:00 p.m. UTC will have access to a detailed view of the BTC/USDT order book. This chart combines two powerful tools: the Volume Heatmap and the Cumulative Volume Delta (CVD), offering a window into market sentiment and potential price levels.
Understanding the Volume Heatmap
The upper section of the Spot CVD chart displays a volume heatmap, which tracks trading activity at each price level for the BTC/USDT spot pair. The background color intensifies when the price lingers in a specific range or makes a significant move. These brighter zones often act as support or resistance, giving traders a visual cue for where the market may react.
What Cumulative Volume Delta Reveals
Below the heatmap, the Cumulative Volume Delta (CVD) indicator provides a running total of buy and sell orders, segmented by order size. As buy orders increase, the corresponding line rises. The yellow line tracks orders between $100 and $1,000, while the brown line represents large orders between $1 million and $10 million. This differentiation helps traders gauge the behavior of retail versus institutional participants.
Why This Matters for Traders
By observing both the heatmap and CVD together, traders can identify where significant buying or selling pressure has accumulated. For instance, a bright zone on the heatmap coinciding with a rising CVD line may indicate a strong support level. Conversely, a fading heatmap with declining CVD could signal weakening interest. The upcoming July 21 session provides a fresh snapshot of these dynamics, which can inform short-term trading decisions.
Conclusion
The Spot CVD chart for BTC/USDT offers a structured way to analyze order book activity. The July 21 analysis at 2:00 p.m. UTC will highlight current support and resistance zones, as well as shifts in order flow between small and large traders. This data-driven approach helps traders avoid speculation and focus on verifiable market signals.
FAQs
Q1: What does the volume heatmap on the Spot CVD chart show?
The volume heatmap tracks trading volume at each price level. Brighter colors indicate where the price has spent more time or made large moves, often marking potential support or resistance areas.
Q2: How is the cumulative volume delta (CVD) calculated?
CVD is the running total of buy minus sell orders, segmented by order size. It shows whether buying or selling pressure is dominant at a given time.
Q3: What do the yellow and brown lines in the CVD represent?
The yellow line tracks orders between $100 and $1,000, typically retail activity. The brown line tracks large orders between $1 million and $10 million, often associated with institutional traders.
Disclaimer: The information provided is not trading advice, Bitcoinworld.co.in holds no liability for any investments made based on the information provided on this page. We strongly recommend independent research and/or consultation with a qualified professional before making any investment decisions.
