

Stellar Lumen (XLM) is showing signs of life! After a period of consolidation, XLM is attempting a fresh surge, sparking interest among crypto enthusiasts. Will it sustain the momentum and break through key resistance levels? Let’s dive into a detailed analysis of XLM’s recent price action and what to expect in the near future.
Stellar Lumen (XLM) Eyes Fresh Surge: Can it Break $0.1325?
- XLM is attempting a fresh surge from the $0.1240 zone against the US Dollar.
- Currently, XLM price is trading below $0.140 and the 55 simple moving average (4 hours).
- To gain bullish momentum, XLM price must clear $0.1325.
Like Bitcoin, Stellar Lumen (XLM) price is trading in a positive zone above $0.1240 against the US Dollar. The immediate challenge for XLM is to overcome the $0.1325 resistance level to unlock further upward potential.
XLM/USD: Recent Price Action
Following a steady climb, Stellar Lumen faced a minor setback near the $0.1620 mark against the US Dollar. The XLM/USD pair dipped below the $0.1400 support, eventually testing the $0.1240 zone.
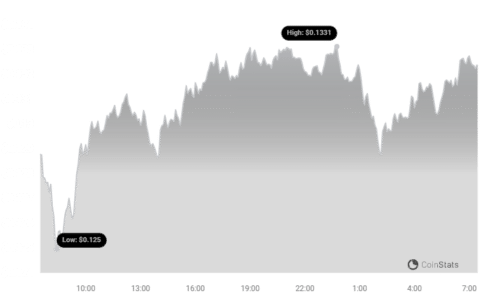
A low was established around $0.1241, and the price is now making another attempt to rise. There was a break above the $0.12030 resistance zone. The price even tested the 23.6% Fib retracement level of the downward move from the $0.1624 swing high to the $0.1241 low.
See Also: The Price Of Solana (SOL) Has Crossed The $200 Resistance, What’s Next For Solana?
Currently, XLM is trading below $0.140 and the 55 simple moving average (4 hours). Bulls are aiming for a close above a significant bearish trend line, which presents resistance near $0.1325 on the 4-hour chart.
Key Resistance and Support Levels to Watch
On the upside, the immediate hurdle lies near the $0.1325 zone. A more substantial resistance awaits near the $0.1440 level, coinciding with the 50% Fib retracement level of the decline from $0.1624 to $0.1241.
A decisive move beyond $0.1440 could propel the price towards the $0.160 zone. Further gains could potentially lead to $0.1650 or even $0.170.
Conversely, initial support can be found near the $0.1240 level, with stronger support around the $0.1150 zone.
Additional losses could drag the price towards $0.1040 in the short term, potentially retesting the $0.100 level.
The chart currently indicates that XLM price is trading below $0.140 and the 55 simple moving average (4 hours). Overall, a significant uptrend could begin if the price decisively breaks above the $0.1325 resistance zone.
Technical Indicators: A Quick Glance
- 4 hours MACD: Losing momentum in the bullish zone.
- 4 hours RSI: Currently below the 50 level.
- Key Support Levels: $0.1240 and $0.1150.
- Key Resistance Levels: $0.1325, $0.1440, and $0.160.
Disclaimer: The information provided is not trading advice. Bitcoinworld.co.in holds no liability for any investments made based on the information provided on this page. We strongly recommend independent research and/or consultation with a qualified professional before making any investment decisions.
#Binance #WRITE2EARN
Disclaimer: The information provided is not trading advice, Bitcoinworld.co.in holds no liability for any investments made based on the information provided on this page. We strongly recommend independent research and/or consultation with a qualified professional before making any investment decisions.