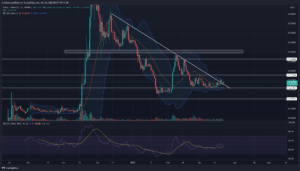
The cryptocurrency market is known for its rollercoaster rides, and GALA (GALA) has certainly been on one lately! For the past three months, every upward blip in GALA’s downtrend has been met with strong selling pressure, creating prime entry points for those betting against the altcoin. This consistent pressure has pushed GALA’s price down to around $0.21, marking a significant 45% plunge from its February peak of $0.362. Ouch!
GALA’s Price Plunge and Potential Rebound: What’s Happening?
Just when things looked bleak, buyers stepped in, initiating a bounce from the $0.21 support level. The emergence of a morning star candle pattern hinted at a potential trend reversal. However, the upward momentum stalled at the $0.277 mark, a level that previously acted as support but had now flipped into resistance. Despite this sluggish price action, crypto enthusiasts noticed a spark of hope on March 19th.
On this day, GALA’s price decisively broke out from a descending trendline that had been capping its gains. This breakout is often seen as a bullish signal, suggesting the potential start of a more substantial rebound. But is this rebound for real, or is it just a temporary breather before another leg down? Let’s dive deeper into the technical analysis to find out!

Decoding the Price Action: Key Technical Indicators in Play
The breakout candle wasn’t just a random spike; it actually tagged the 50-day Exponential Moving Average (EMA) before retracing to retest the broken descending trendline. This retest is crucial. At this point, another morning star candle formation appeared, reinforcing the idea that the previous resistance had now transformed into support. This is a classic example of market dynamics in action!
However, in the volatile world of crypto, nothing is guaranteed. Here’s the critical point: if GALA’s price fails to hold above this falling trendline and dips below it again, it could signal a ‘bear trap’.
Bear Trap Scenario: What Could Happen if the Rebound Fails?
A bear trap is a situation where a breakout to the upside turns out to be false, luring buyers in before the price reverses and plunges further down. In GALA’s case, if the breakout proves to be a bear trap, we could see the price retesting the January lows around $0.15. This would be a significant drop and a harsh reminder of the risks involved in crypto trading.
Bullish Divergence on the RSI: A Sign of Hidden Strength?
While the price action might seem uncertain, the Relative Strength Index (RSI) indicator is showing a potentially bullish divergence. The RSI slope (currently at 48) is making higher highs, even as GALA’s price struggles. This divergence suggests that buying pressure might be building up beneath the surface, and buyers are gradually gaining strength despite the price stagnation. It’s like a tug-of-war where the buyers are slowly but surely pulling harder!
Bollinger Bands: Squeezing Tight – Is Volatility About to Explode?
Another interesting observation comes from the Bollinger Bands. The narrowing of the Bollinger Band range indicates a period of low volatility in GALA’s price. Historically, periods of low volatility are often followed by periods of high volatility. Think of it like a spring being compressed – the tighter it gets, the more powerfully it can bounce back!
Furthermore, after touching the upper Bollinger Band, GALA’s price retraced back to the midline. This midline is often considered a neutral level, but in this context, it could act as a launchpad. If buyers can successfully defend the $0.23 support level (which is close to the midline), it could pave the way for another attempt to break through the resistance levels.
Key Price Levels for GALA Traders to Watch
To navigate the current market conditions for GALA, keep a close eye on these crucial price levels:
- Resistance Levels:
- $0.277: The immediate resistance level that needs to be overcome for a sustained bullish move.
- $0.36: The February high and a significant hurdle for any major upward trend.
- Support Levels:
- $0.23: A crucial short-term support level, coinciding with the Bollinger Band midline.
- $0.21: The recent low and a strong support level that buyers defended.
- $0.15: The January low and a critical long-term support level. A break below this could signal further downside.
What’s Next for GALA? Navigating the Uncertainty
The current price action of GALA is at a critical juncture. The breakout from the descending trendline and the bullish divergence on the RSI offer reasons for cautious optimism. However, the possibility of a bear trap and the overall market volatility cannot be ignored.
For crypto traders, this means:
- Watch for a decisive break above $0.277 resistance: This would confirm the bullish momentum and open the door for further gains.
- Monitor the $0.23 and $0.21 support levels: A break below these levels could invalidate the current rebound and increase the risk of a drop to $0.15.
- Pay attention to broader market sentiment: Bitcoin’s price action and overall crypto market trends will significantly influence GALA’s movements.
- Manage your risk: Use stop-loss orders and trade with caution, especially in volatile market conditions.
The crypto market is dynamic and unpredictable. While technical analysis provides valuable insights, it’s essential to stay informed, adapt to changing market conditions, and always do your own research before making any investment decisions. Is GALA poised for a genuine rally, or will the bears regain control? Only time will tell, but by keeping a close watch on these key levels and indicators, you can be better prepared to navigate the potential opportunities and risks ahead.
Related Posts – Ferrari joins the NFT universe through a collaboration with a Swiss…
Disclaimer: The information provided is not trading advice, Bitcoinworld.co.in holds no liability for any investments made based on the information provided on this page. We strongly recommend independent research and/or consultation with a qualified professional before making any investment decisions.


