
Cryptocurrency markets are known for their rapid fluctuations, and The Graph (GRT) is currently riding a wave of positive momentum. Over the past week, GRT has captured the attention of investors with a notable price surge. But what’s driving this upward trend, and can it last? Let’s delve into the recent performance of The Graph and analyze the key factors influencing its price.
GRT Price Rockets: A Look at the Numbers
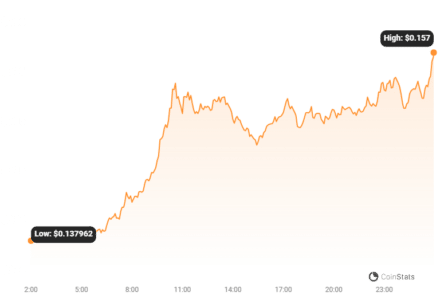
In the last 24 hours alone, The Graph’s price has jumped by a significant 9.58%, pushing it to $0.15. Looking at a broader timeframe, the past week has been even more impressive for GRT holders. The price has climbed over 21.0%, ascending from $0.13 to its current level. While this rally is exciting, it’s important to remember that GRT still has ground to cover to reach its all-time high of $2.84.
Decoding Volatility: Is GRT’s Price Movement Stable?
Understanding volatility is crucial in the crypto market. Volatility essentially measures how much the price of an asset swings up and down over time. Higher volatility means greater price fluctuations, which can present both opportunities and risks for traders.
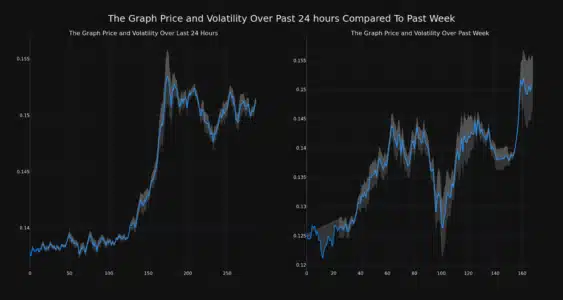
To visualize GRT’s volatility, let’s examine the Bollinger Bands in the charts below. Bollinger Bands are a technical analysis tool that helps us understand price volatility. The gray bands in the charts represent these Bollinger Bands for both daily (left chart) and weekly (right chart) price movements.
Key takeaway: Wider Bollinger Bands indicate higher volatility, meaning the price is experiencing larger swings. Conversely, narrower bands suggest lower volatility and more stable price movement.
Read Also: NEAR Protocol Up More Than 3% In 24 hours
Trading Volume & Circulating Supply: What Do They Tell Us About GRT?
Beyond price and volatility, analyzing trading volume and circulating supply can offer further insights into a cryptocurrency’s health and potential.
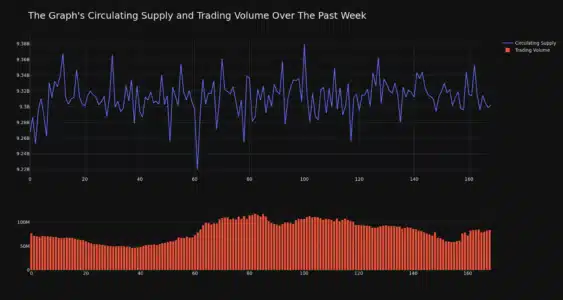
- Trading Volume: This represents the total amount of GRT coins that have been traded within a specific period. A rise in trading volume often suggests increased interest and activity in the coin.
- Circulating Supply: This refers to the number of GRT coins that are currently available to the public and in circulation in the market.
In the case of The Graph, its trading volume has increased by 8.0% over the past week. Interestingly, this increase in trading volume has coincided with a slight rise of 0.38% in the coin’s circulating supply. The current circulating supply of GRT stands at 9.31 billion coins.
According to recent data, The Graph holds the #47 rank in market capitalization, with a market cap of $1.41 billion. Market capitalization is calculated by multiplying the circulating supply of a cryptocurrency by its current price. It’s a key metric to understand the overall size and dominance of a crypto asset.
What is The Graph (GRT) and Why Does it Matter?
For those new to The Graph, it’s essential to understand its purpose within the broader crypto ecosystem. The Graph is not just another cryptocurrency; it plays a crucial role in the world of decentralized data.
In simple terms, The Graph is an indexing protocol for querying networks like Ethereum and IPFS. Think of it as the ‘Google’ of blockchains. Blockchains store vast amounts of data, but accessing and organizing this data efficiently can be challenging. The Graph solves this problem by making it easier for developers to access blockchain data to power their decentralized applications (dApps).
Key Benefits of The Graph:
- Efficient Data Access: Simplifies the process of retrieving blockchain data for dApps.
- Decentralized Infrastructure: Provides a decentralized alternative to centralized data APIs.
- Empowering dApp Development: Enables developers to build faster and more efficient dApps.
- Growing Ecosystem: Supports a wide range of blockchains and dApps, fostering growth in the Web3 space.
Is The Graph (GRT) a Good Investment?
The recent price surge and positive market indicators are encouraging for GRT. However, like all cryptocurrencies, investing in The Graph comes with risks. The crypto market is inherently volatile, and price fluctuations can be significant.
Factors to Consider Before Investing in GRT:
- Market Sentiment: Crypto prices are heavily influenced by overall market sentiment and trends.
- Technology Adoption: The success of The Graph depends on the continued growth and adoption of Web3 and dApps.
- Competition: The blockchain indexing space is evolving, and competition exists.
- Your Risk Tolerance: Assess your personal risk tolerance before investing in any cryptocurrency.
Conclusion: Navigating GRT’s Bullish Trend
The Graph (GRT) is currently experiencing a notable bullish phase, marked by significant price increases and rising trading volume. Its fundamental role in indexing blockchain data positions it as a vital component of the Web3 infrastructure. While the recent rally is promising, remember that the cryptocurrency market is dynamic and unpredictable.
Before making any investment decisions regarding GRT or any other cryptocurrency, conduct thorough research, consider your risk tolerance, and ideally consult with a financial advisor. Staying informed and making well-considered choices is key to navigating the exciting yet complex world of crypto investments.
Disclaimer: The information provided is not trading advice. Bitcoinworld.co.in holds no liability for any investments made based on the information provided on this page. We strongly recommend independent research and/or consultation with a qualified professional before making any investment decisions.
Disclaimer: The information provided is not trading advice, Bitcoinworld.co.in holds no liability for any investments made based on the information provided on this page. We strongly recommend independent research and/or consultation with a qualified professional before making any investment decisions.