Buckle up, crypto enthusiasts! Solana (SOL) has been on a rollercoaster ride, and recent market movements suggest we’re at a critical point. After establishing a solid base above $100.00, SOL price experienced a significant surge, breaking through multiple resistance levels. But is this bullish momentum sustainable, or are we heading for a correction? Let’s dive into the technical analysis to decipher what’s next for Solana.
Solana’s Price Action: A Recap of Recent Swings
Solana showcased impressive strength, climbing past the $110.00 and even the $120.00 resistance marks. The price confidently soared above the 55 simple moving average on the 4-hour chart, reaching a peak of $143.57. This bullish run indicated strong buying interest and positive market sentiment around Solana. However, as with any crypto asset, pullbacks are part of the game. Recently, SOL faced a downward correction, dipping below the $135 and $132 levels.
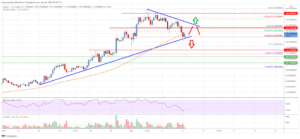
Currently, Solana’s price is consolidating around the $124 support area. To understand the depth of this retracement, let’s consider the Fibonacci retracement levels. The price dipped below the 50% Fibonacci retracement level of the recent upward swing (from $117.50 to $143.57). Intriguingly, it’s now testing the 76.4% Fibonacci retracement level, a key level that could determine the next direction.
Decoding the Chart: Contracting Triangle Formation
Looking at the 4-hour chart for the SOL/USD pair, a significant technical pattern is emerging: a contracting triangle. This pattern is characterized by converging trendlines, indicating a period of consolidation and indecision in the market. For Solana, the support for this triangle is forming near the $123 mark.

Contracting triangles are often precursors to breakouts or breakdowns. The direction of the breakout will typically dictate the next major price movement. So, what are the key levels to watch?
Key Support and Resistance Levels for Solana Traders
Navigating the crypto market requires a keen understanding of support and resistance levels. These levels act as potential barriers or springboards for price movements. For Solana right now, these levels are crucial:
- Immediate Resistance: The $130.00 level is the immediate hurdle for Solana to overcome on the upside.
- Major Resistance: Beyond $130.00, the $132.00 mark represents a more significant resistance. Breaking above this level is essential for any sustained upward momentum.
- Critical Support: The $123 level, forming the base of the contracting triangle, is the immediate support.
- Major Support: A more critical support level lies around $120.00. This level must hold to prevent a potentially deeper correction.
Bullish vs. Bearish Scenarios: What to Expect?
Now, let’s explore the potential scenarios based on these key levels:
Bullish Scenario: Breakout Above Resistance
For Solana to resume its upward trajectory, it needs to decisively break above the $132.00 resistance. If buyers manage to push the price above this level, we could see a significant surge. According to the analysis, a break above $140.00 could pave the way for a move towards $150.00. This bullish breakout would signal renewed buying interest and potentially trigger further gains.
Bearish Scenario: Breakdown Below Support
Conversely, if Solana fails to hold the $120.00 support, we could witness a more substantial price drop. A breakdown below this level might indicate increasing selling pressure and a shift in market sentiment. In a bearish scenario, the analysis suggests a potential fall towards the $105.00 level. Traders should be prepared for this possibility and manage their risk accordingly.
Actionable Insights for Crypto Traders
So, what does this mean for crypto traders? Here are some actionable insights:
- Watch the $132 and $120 Levels Closely: These are the critical levels that will likely determine Solana’s short-term direction.
- Triangle Breakout/Breakdown: Pay close attention to whether Solana breaks out of the contracting triangle upwards or downwards. This could provide a strong trading signal.
- Manage Risk: Given the current uncertainty, it’s crucial to manage your risk. Use stop-loss orders to protect your capital, especially if you are trading on leverage.
- Stay Updated: The crypto market is highly dynamic. Keep an eye on market news, overall crypto sentiment, and further technical analysis to make informed trading decisions.
Currently, Solana’s price is trading above $110.00 and the 55 simple moving average on the 4-hour chart, which is a positive sign. However, the immediate path forward hinges on breaking the $132 resistance or holding above the $120 support.
In Conclusion: Solana is at a crossroads. The contracting triangle pattern and the key support and resistance levels highlight a period of potential volatility and opportunity. Whether SOL breaks out to new highs or faces a deeper correction remains to be seen. Traders should remain vigilant, monitor these key levels, and be prepared to react to the unfolding market action. Keep an eye on Solana – it’s definitely one to watch in the crypto market!
Related Posts – XRP Price Goes Up After Unexpected Reappearance On Coinbase
Disclaimer: The information provided is not trading advice, Bitcoinworld.co.in holds no liability for any investments made based on the information provided on this page. We strongly recommend independent research and/or consultation with a qualified professional before making any investment decisions.


