Navigating the volatile world of cryptocurrency can feel like riding a rollercoaster. Recently, Bitcoin SV (BSV) has been experiencing a noticeable dip in its price. If you’re tracking BSV or just curious about what’s happening in the crypto markets, let’s dive into the recent price movements of Bitcoin SV and try to understand the factors at play.
Bitcoin SV Price Check: What’s the Latest?
Over the past 24 hours, the price of Bitcoin SV (BSV) has seen a decrease of 3.55%, bringing it down to $81.56. This continues a trend from the past week, where BSV has experienced a significant 17.0% drop, falling from $97.88 to its current level. This downward pressure is something investors and enthusiasts are keeping a close eye on.
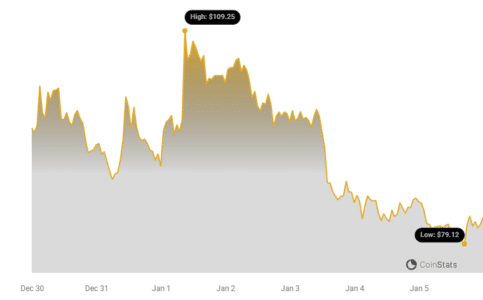
Looking at the chart above, you can visualize this recent price action. But what does this price movement really tell us?
Decoding the Price Chart: 24 Hours vs. 7 Days
To get a better grasp of BSV’s recent performance, it’s helpful to compare both short-term and slightly longer-term price movements. The following chart breaks down the price movement and volatility of Bitcoin SV (BSV) over the last 24 hours (on the left) and the past week (on the right).
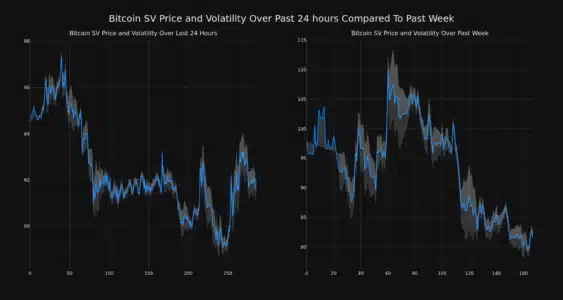
Notice those gray bands in the charts? Those are called Bollinger Bands. They are a handy tool to measure volatility in price movements. Let’s break down what they mean:
- Bollinger Bands: These bands essentially show the range within which the price of an asset typically fluctuates.
- Volatility Indicator: The width of these bands tells us about volatility. Wider bands, or a larger gray area, indicate higher volatility. This means the price is swinging more dramatically.
In simpler terms, if the gray area is wide, expect more price swings! It’s a visual way to quickly assess how stable or unstable the price of BSV has been recently.
See Also: The Price Of Quant (QNT) Dropped More Than 7% Within 24 Hours
Delving Deeper: Trading Volume and Circulating Supply
Price movements are just one piece of the puzzle. To get a more complete picture, we also need to consider trading volume and circulating supply. Let’s see how these factors are playing out for Bitcoin SV.
- Trading Volume Decline: Interestingly, the trading volume for BSV has decreased by a significant 87.0% over the past week. This suggests less activity in the market for BSV, which can sometimes contribute to price instability.
- Circulating Supply Increase: On the flip side, the circulating supply of Bitcoin SV (BSV) has increased by 1.8% in the same week.
These two factors moving in opposite directions can provide interesting insights. Let’s visualize this relationship:
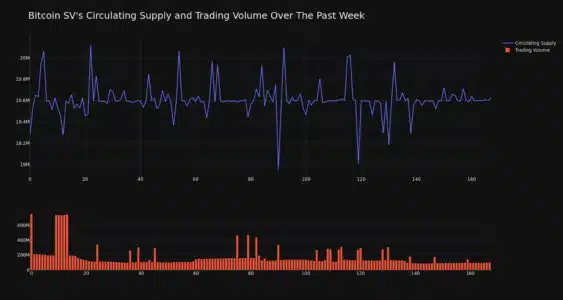
Currently, the circulating supply of BSV stands at 19.60 million coins. This is a substantial portion of its total max supply, estimated to be 93.33% of the 21.00 million limit.
Where Does BSV Stand in the Market?
Finally, let’s put BSV’s market position into perspective. According to the latest data, Bitcoin SV currently holds the #50 rank in market capitalization, with a market cap of $1.60 billion. This ranking provides a sense of BSV’s overall size and dominance within the broader cryptocurrency market.
Key Takeaways and What to Consider
To summarize the recent movements in Bitcoin SV (BSV):
- Price Decline: BSV has experienced a price decrease of 3.55% in the last 24 hours and a more significant 17% drop over the past week.
- Increased Volatility: Bollinger Bands indicate ongoing price volatility for BSV.
- Decreased Trading Volume: Trading activity has significantly reduced in the past week.
- Increased Circulating Supply: The number of BSV coins in circulation has slightly increased.
- Market Cap Rank: BSV is currently ranked #50 by market capitalization.
It’s crucial to remember that the cryptocurrency market is inherently volatile. Price fluctuations are common and can be influenced by a wide range of factors, including overall market sentiment, technological developments, regulatory news, and more.
For anyone considering investment in Bitcoin SV or any cryptocurrency, it’s essential to conduct thorough research and understand the risks involved. Keeping an eye on price charts, volatility indicators, trading volume, and circulating supply can offer valuable insights, but they are just part of a larger picture.
Disclaimer: The information provided in this article is for informational purposes only and does not constitute trading advice. Bitcoinworld.co.in is not liable for any investment decisions made based on this information. We strongly advise readers to conduct independent research and/or seek advice from a qualified professional before making any investment decisions in the cryptocurrency market.
Disclaimer: The information provided is not trading advice, Bitcoinworld.co.in holds no liability for any investments made based on the information provided on this page. We strongly recommend independent research and/or consultation with a qualified professional before making any investment decisions.