
Hey crypto enthusiasts! Buckle up as we dive into the latest buzz around Binance Coin (BNB). In a market that’s often as unpredictable as the weather, BNB has shown a surprising upward tick. After navigating some choppy waters, is BNB finally charting a course towards brighter horizons? Let’s break down the recent price action and see what’s fueling this movement.
BNB Price Bounces Back: A 24-Hour Snapshot
Over the last day, BNB has caught the attention of traders and investors alike, witnessing a notable 3.7% increase in its price. This jump has pushed BNB to $325.62, according to recent data. In a world of red and green candles, this green signal is definitely something to take note of.
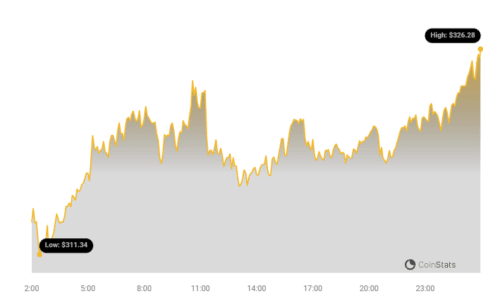
Looking at the chart above, you can see the recent upward trajectory. But is this just a blip on the radar, or is there more to this story?
Navigating the Weekly Downtrend: Is a Reversal in Sight?
While the 24-hour surge is encouraging, it’s important to zoom out and look at the bigger picture. The past week has been somewhat of a rollercoaster for BNB, with an overall 3.0% decrease. The price dipped from $327.78 to the current level, highlighting the volatility that’s become synonymous with the crypto market. This recent daily gain is trying to counter that weekly dip, sparking the question: Is BNB poised for a trend reversal?
Currently, BNB is still some distance from its all-time high of $686.31. Reaching those peaks again requires sustained positive momentum and broader market support. However, every journey begins with a single step, and this 24-hour increase could be the first step in a new upward climb.
Decoding Volatility: What Do the Charts Tell Us?
To understand BNB’s price movements better, let’s delve into volatility. Volatility essentially measures how much the price of an asset fluctuates over time. High volatility means prices can swing dramatically, while low volatility suggests more stable price action.
The following charts provide a visual representation of BNB’s price movement and volatility over the past 24 hours versus the past week. Take a look:
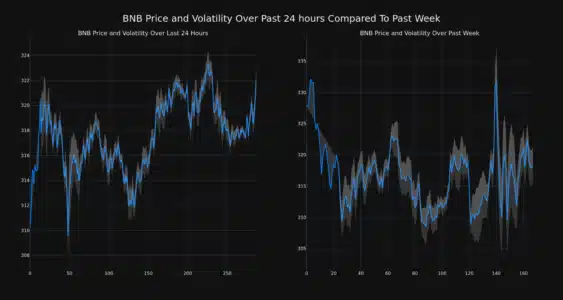
Notice those gray bands? Those are Bollinger Bands, a popular technical analysis tool used to gauge volatility. Think of them as dynamic price ranges. Here’s a quick breakdown:
- Wider Bands = Higher Volatility: When the bands widen, it indicates increased price fluctuations and uncertainty in the market.
- Narrower Bands = Lower Volatility: Conversely, narrower bands suggest price stability and less dramatic swings.
By observing the Bollinger Bands on both the daily and weekly charts, you can get a sense of the changing volatility landscape for BNB. Currently, the charts suggest moderate volatility, but keep an eye on those bands as they can signal potential shifts in market momentum.
See Also: The Price Of Aptos (APT) Increased More Than 24% Within 24 Hours
Trading Volume vs. Circulating Supply: What’s the Story?
Now, let’s shift our focus to trading volume and circulating supply – two crucial indicators that can provide insights into the health and dynamics of BNB’s market.
- Trading Volume Decline: Interestingly, the trading volume for BNB has decreased by 37.0% over the past week. A drop in trading volume can sometimes indicate waning interest or caution among traders. It’s something to monitor closely to see if this trend continues or reverses.
- Circulating Supply Increase: On the flip side, the circulating supply of BNB has seen a slight increase of 0.17% over the same period. An increase in circulating supply means more BNB tokens are available in the market.
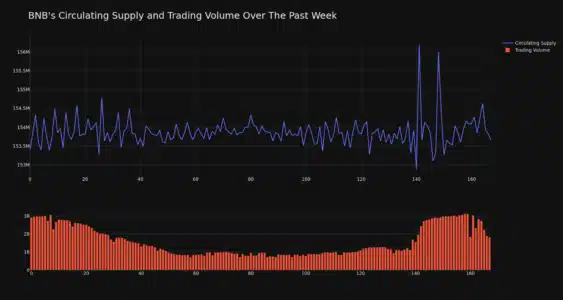
As you can see in the chart above, the interplay between circulating supply and trading volume can offer clues about market sentiment and potential future price movements. Currently, the circulating supply of BNB stands at 153.86 million, representing approximately 76.93% of its maximum supply of 200.00 million. This means that the majority of BNB tokens are already in circulation, which can influence scarcity and potentially price.
BNB Market Cap and Ranking: Where Does it Stand?
Finally, let’s talk about market capitalization. Market cap is essentially the total value of a cryptocurrency and is calculated by multiplying the current price by the circulating supply. It’s a key metric for understanding the size and dominance of a crypto asset.
Currently, BNB holds the #4 spot in the cryptocurrency market cap rankings, with a market cap of $49.42 billion. This robust market cap underscores BNB’s position as a leading cryptocurrency and its significant presence in the digital asset space.
In Conclusion: Is BNB’s Bullish Momentum Sustainable?
BNB’s recent 24-hour price surge offers a glimmer of hope after a week of downward pressure. While the 3.7% increase is encouraging, it’s crucial to consider the broader context of weekly trends, trading volume, and overall market sentiment. The slight increase in circulating supply and decrease in trading volume present a mixed bag of signals.
Will BNB sustain this bullish momentum? Only time will tell. Keep a close watch on trading volumes, broader market trends, and any news surrounding Binance and the BNB ecosystem. As always, the crypto market is dynamic, and staying informed is your best strategy.
Disclaimer: The information provided is not trading advice. Bitcoinworld.co.in holds no liability for any investments made based on the information provided on this page. We strongly recommend independent research and/or consultation with a qualified professional before making any investment decisions.
Disclaimer: The information provided is not trading advice, Bitcoinworld.co.in holds no liability for any investments made based on the information provided on this page. We strongly recommend independent research and/or consultation with a qualified professional before making any investment decisions.