

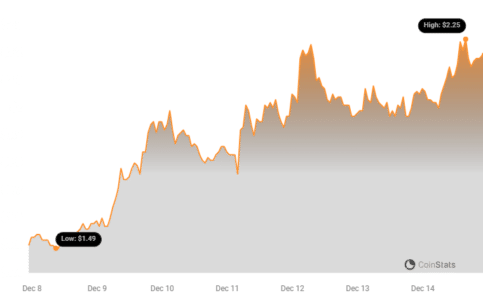
Excitement is brewing in the crypto market as Immutable (IMX), the token powering the popular Layer-2 scaling solution for NFTs on Ethereum, is making significant waves. Over the past day, IMX has surged by an impressive 9.18%, pushing its price to $2.18. But that’s not all – this upward momentum is part of a larger bullish trend that has seen IMX climb a remarkable 47.0% in just the last week! Let’s dive into the details of this price surge, analyze the market indicators, and explore what might be driving this crypto’s impressive performance.
What’s Fueling the Immutable (IMX) Price Rally?
Immutable X has been gaining traction as a go-to platform for NFTs, offering near-instant, gas-free transactions. This utility, combined with broader positive sentiment in the crypto market, could be contributing to the recent price appreciation. Let’s break down the key highlights:
- Strong Daily Gains: A 9.18% increase in the last 24 hours showcases robust investor interest and buying pressure for IMX.
- Impressive Weekly Performance: The 47% jump in the past week is a significant move, indicating sustained positive momentum and potentially a shift in market sentiment towards IMX.
- Distance from All-Time High: While currently trading at $2.18, IMX is still below its all-time high of $9.52. This gap suggests there might be room for further growth if the bullish trend continues and market conditions remain favorable.
Decoding IMX Price Movement and Volatility
To understand the sustainability of this rally, it’s crucial to analyze the price movement and volatility. Charts provide valuable insights into market behavior and potential future trends. Let’s examine the volatility of IMX over different timeframes:
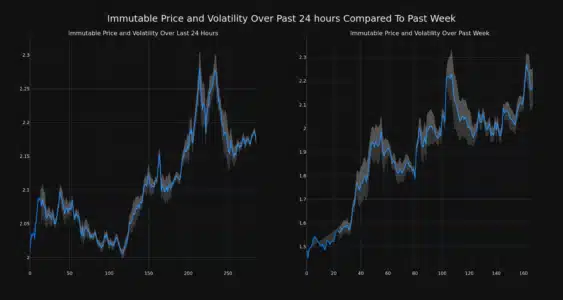
The charts above utilize Bollinger Bands (the gray bands) to visually represent volatility. Here’s what these bands tell us:

- Bollinger Bands Explained: These bands measure market volatility. Wider bands indicate higher volatility, suggesting larger price swings. Conversely, narrower bands point to lower volatility and more stable price movement.
- Daily Volatility (Left Chart): By examining the Bollinger Bands on the left chart, we can assess the short-term price fluctuations of IMX. Wider bands here would suggest more intraday price swings.
- Weekly Volatility (Right Chart): The right chart provides a broader perspective on volatility over the past week. Analyzing the width of these bands helps understand the overall stability or instability of IMX’s price in the medium term.
See Also: Zil Soar As Zilliqa Group Established A Strategic Partnership With Google Cloud
Trading Volume and Circulating Supply: Are They in Sync?
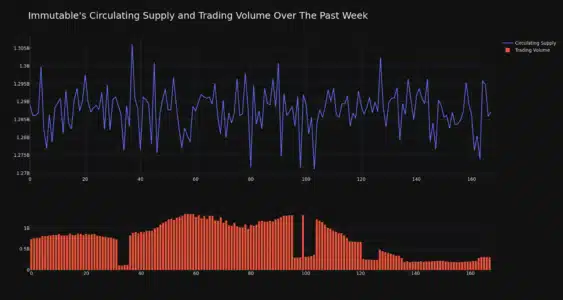
Another crucial aspect to consider is the trading volume and circulating supply of IMX. These metrics can offer clues about the health and sustainability of the price trend.
- Trading Volume Decline: Interestingly, the trading volume for IMX has decreased by 58.0% over the past week. A significant drop in trading volume alongside a price increase can sometimes be a cautionary signal, suggesting that the price rise might not be backed by strong buying interest. However, it’s important to consider this in context with other factors.
- Circulating Supply Reduction: The circulating supply of IMX has also slightly decreased by 0.16% in the same period. A decrease in circulating supply could, in theory, exert upward pressure on price if demand remains constant or increases.
- Directional Tandem: The report notes that trading volume and circulating supply have moved “directionally in tandem.” This suggests a potential correlation between these two factors, although further analysis would be needed to confirm the nature of this relationship.
IMX Market Cap and Supply Metrics: Key Takeaways
Understanding the market capitalization and supply dynamics provides a broader perspective on IMX’s position in the crypto landscape:
- Circulating Supply: Currently, 1.29 billion IMX tokens are in circulation.
- Percentage of Max Supply: This circulating supply represents approximately 64.41% of the total maximum supply of 2.00 billion IMX tokens.
- Market Cap Ranking: With a market capitalization of $2.81 billion, IMX currently holds the #31 rank in the overall cryptocurrency market. This ranking indicates its significant market presence and investor valuation.
Is the IMX Rally Sustainable? What’s Next?
Immutable (IMX) has demonstrated impressive price gains recently. The 47% weekly surge and the latest 9% daily increase are certainly eye-catching. However, the decrease in trading volume alongside the price increase warrants caution. For investors, it’s crucial to:
- Monitor Volatility: Keep an eye on volatility indicators like Bollinger Bands to understand the risk associated with IMX trading.
- Track Trading Volume: A sustained price rally ideally should be accompanied by healthy trading volume. Watch for volume increases to confirm continued buying interest.
- Stay Informed: Keep up-to-date with news and developments related to Immutable X and the broader NFT market. Partnerships, platform updates, and overall market sentiment can significantly impact IMX’s price.
In conclusion, Immutable (IMX) is experiencing a notable bullish phase. While the short-term gains are exciting, a balanced perspective that considers volatility, trading volume, and broader market dynamics is essential for making informed decisions. As always, remember to conduct thorough research and consider consulting with a financial advisor before making any investment in cryptocurrencies.
Disclaimer: The information provided is not trading advice. Bitcoinworld.co.in holds no liability for any investments made based on the information provided on this page. We strongly recommend independent research and/or consultation with a qualified professional before making any investment decisions.
Disclaimer: The information provided is not trading advice, Bitcoinworld.co.in holds no liability for any investments made based on the information provided on this page. We strongly recommend independent research and/or consultation with a qualified professional before making any investment decisions.