Hold onto your hats, crypto enthusiasts! The market is buzzing with activity, and Polygon (MATIC) is making headlines once again. If you’re tracking your portfolio or just curious about the latest crypto trends, you’ve probably noticed MATIC’s recent upward swing. Let’s dive into the numbers and analyze what’s fueling this price jump for Polygon.
MATIC Price Rockets Upward: A 24-Hour Snapshot
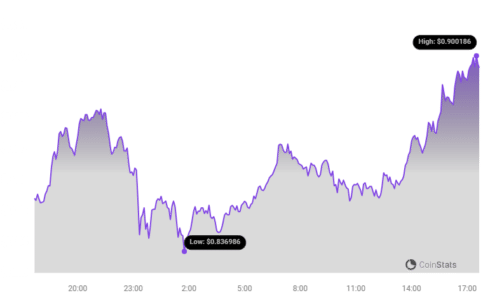
In the whirlwind world of cryptocurrency, 24 hours can feel like an eternity. Over the past day, Polygon (MATIC) has shown impressive momentum, with its price climbing by a solid 4.54%. This surge has pushed MATIC’s price to $0.895 as of today. But is this just a blip on the radar, or is there more to this upward trend?

Zooming Out: MATIC’s Weekly Performance
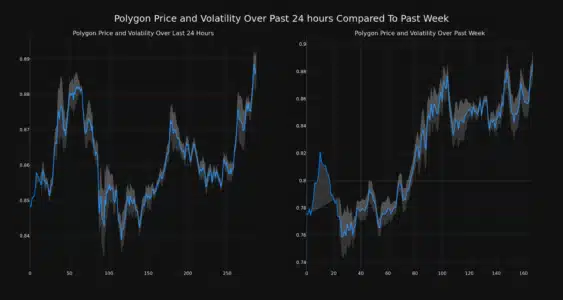
Looking at the bigger picture, MATIC’s positive performance isn’t confined to just the last 24 hours. Over the past week, Polygon has been on a notable uptrend, racking up a gain of 14.0%. This healthy climb from $0.77 to its current price suggests sustained buying interest and growing confidence in the Polygon network. For those who’ve been following MATIC, this upward trajectory is certainly encouraging. However, it’s worth remembering that MATIC’s all-time high sits at $2.92, indicating there’s still considerable room for potential growth – or volatility.
Decoding Price Movement and Volatility
To better understand MATIC’s price action, let’s examine the interplay of price movement and volatility. Volatility, in simple terms, is how much and how quickly the price of an asset fluctuates. High volatility means prices can swing dramatically in short periods, while low volatility suggests more stable price movements.

The charts above provide a visual representation of Polygon’s price movement and volatility. The left chart focuses on the last 24 hours, while the right chart covers the past week. Notice those gray bands? Those are Bollinger Bands, a popular tool used to measure volatility.
Understanding Bollinger Bands:
- Bollinger Bands essentially show the range within which the price of an asset typically trades.
- Wider bands indicate higher volatility – meaning the price is swinging more dramatically.
- Narrower bands suggest lower volatility and more stable price action.
- When you see a wider gray area in the charts, it signals a period of increased price fluctuation for MATIC.
See Also: The Price Of NEAR Protocol (NEAR) Has Increased More Than 5% Within 24 Hours
Trading Volume vs. Circulating Supply: What’s the Story?
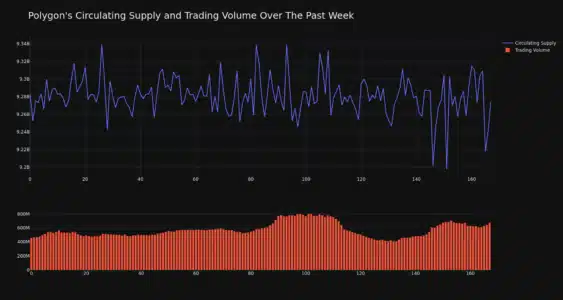
Beyond price and volatility, another crucial aspect to consider is trading volume and circulating supply. Trading volume reflects the total amount of MATIC coins that have been traded within a specific period. Circulating supply, on the other hand, refers to the number of MATIC coins currently available in the market.

Interestingly, over the past week, MATIC’s trading volume has surged by a significant 47.0%. This substantial increase in trading activity often accompanies price increases, as it suggests heightened market interest and buying pressure. Conversely, the circulating supply of MATIC has slightly decreased by 0.1% during the same period.
What does this divergence mean?
- Increased Demand: The rise in trading volume coupled with a slight decrease in circulating supply could indicate increased demand for MATIC. When demand outstrips supply, prices tend to rise.
- Potential Scarcity (Slight): While a 0.1% decrease in circulating supply is minimal, any reduction, however small, in available coins when demand is increasing can contribute to upward price pressure.
MATIC’s Market Cap and Supply Dynamics
Currently, the circulating supply of MATIC stands at 9.28 billion coins. This represents a significant portion – approximately 92.83% – of its maximum total supply of 10.00 billion coins. This high percentage of circulating supply suggests that most of the MATIC tokens are already in the market, potentially limiting future supply-driven inflation.
In terms of market capitalization, MATIC currently holds the #15 rank in the cryptocurrency world, boasting a market cap of $8.22 billion. This ranking and market cap solidify Polygon’s position as a major player in the crypto space.
Key Takeaways and Considerations
- Positive Price Momentum: Polygon (MATIC) has demonstrated strong positive price movement in the last 24 hours and over the past week.
- Increased Trading Volume: A significant surge in trading volume suggests growing market interest and buying pressure.
- Volatility in Check: While price is increasing, monitoring volatility through tools like Bollinger Bands remains crucial for understanding risk.
- Strong Market Position: MATIC’s top #15 market cap ranking underscores its significance in the crypto ecosystem.
Looking Ahead: What’s Next for MATIC?
While the recent price surge is undoubtedly positive for MATIC holders, the cryptocurrency market is known for its volatility. It’s essential to stay informed about broader market trends, Polygon network developments, and regulatory news that could impact MATIC’s price. Will MATIC continue its upward trajectory and challenge its all-time high? Only time will tell. However, the current indicators – increased price, rising trading volume, and a strong market position – paint an optimistic picture for Polygon in the short term.
Disclaimer: The information provided is not trading advice. Bitcoinworld.co.in holds no liability for any investments made based on the information provided on this page. We strongly recommend independent research and/or consultation with a qualified professional before making any investment decisions.
Disclaimer: The information provided is not trading advice, Bitcoinworld.co.in holds no liability for any investments made based on the information provided on this page. We strongly recommend independent research and/or consultation with a qualified professional before making any investment decisions.


