Navigating the volatile world of cryptocurrency can feel like riding a rollercoaster. Recent market activity has investors and enthusiasts alike keeping a close watch on price movements, and Quant (QNT) is no exception. Over the past 24 hours, Quant’s (QNT) price has experienced a downturn, prompting questions and sparking discussions within the crypto community. Let’s delve into the details of this price shift, analyze the contributing factors, and explore what it might mean for the future of QNT.
Quant’s Price Performance: A Closer Look
As of recent data, the price of Quant (QNT) has adjusted to $120.01, marking a 7.15% decrease in the last 24 hours. This movement is part of a broader trend, as QNT has also seen an 11.0% loss over the past week, declining from $134.92. While price fluctuations are inherent in the crypto market, understanding the context and underlying indicators is crucial for informed decision-making.
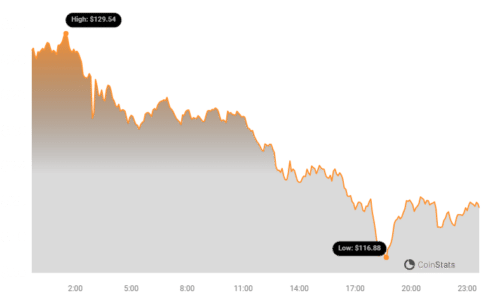
The chart above visually represents QNT’s price trajectory, providing a snapshot of its performance over time. Examining these trends helps to contextualize the recent dip and understand whether it’s an isolated event or part of a larger pattern.
Volatility and Price Movement: Daily vs. Weekly Perspectives
To gain a deeper understanding of QNT’s price dynamics, it’s essential to analyze both short-term (daily) and medium-term (weekly) volatility. Volatility, in essence, measures the degree of price fluctuations over a specific period. High volatility suggests significant price swings, while low volatility indicates more stable price action.
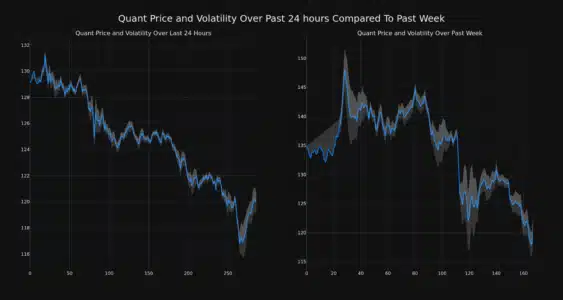
The chart above provides a comparative view of Quant’s price movement and volatility:
- Left Chart (24-hour view): Illustrates the daily price fluctuations and volatility.
- Right Chart (Weekly view): Shows the price movement and volatility over the past week.
Bollinger Bands: Gauging Volatility
The gray bands in these charts are known as Bollinger Bands. These bands are a technical analysis tool used to measure market volatility. Here’s how to interpret them:
- Wider Bands = Higher Volatility: When the Bollinger Bands widen, it signifies increased price volatility. The larger the gray area, the more significant the price swings have been during that period.
- Narrower Bands = Lower Volatility: Conversely, narrower bands suggest lower volatility, indicating a period of relative price stability.
By observing the Bollinger Bands, we can quickly assess the level of risk and potential price fluctuation associated with Quant (QNT) in both the short and medium term.
See Also: The Price Of The Graph (GRT) Fell More Than 7% In 24 Hours
Trading Volume and Circulating Supply: Key Indicators
Beyond price and volatility, trading volume and circulating supply are critical metrics to consider when analyzing a cryptocurrency’s market dynamics.
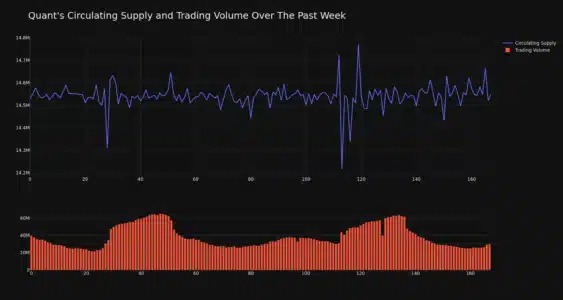
Let’s break down these aspects for Quant (QNT):
- Trading Volume Decrease: Over the past week, the trading volume for QNT has decreased by 25.0%. A decrease in trading volume can sometimes indicate reduced market interest or a potential lack of buying pressure, which can contribute to price declines.
- Circulating Supply Increase: Interestingly, the circulating supply of QNT has increased by 0.14% in the last week, reaching over 14.54 million coins.
Understanding Circulating Supply
Circulating supply refers to the number of cryptocurrency coins that are publicly available and in circulation in the market. For QNT, the current circulating supply is estimated to be 99.53% of its maximum supply of 14.61 million coins. This high percentage suggests that the vast majority of QNT tokens are already in circulation, limiting future supply increases.
Market Cap and Ranking: Where Does QNT Stand?
Market capitalization, or market cap, is a crucial metric that reflects the total value of a cryptocurrency. It’s calculated by multiplying the current price of a coin by its circulating supply. Quant (QNT) currently holds a market cap ranking of #47, with a market capitalization of $1.75 billion. This ranking provides context on QNT’s size and dominance within the broader cryptocurrency market.
What Could Be Driving the Price Movement?
While pinpointing the exact reasons for short-term price fluctuations is challenging, several factors could be influencing QNT’s recent price dip:
- Broader Market Sentiment: The cryptocurrency market is often influenced by overall market sentiment. Negative news or bearish trends in major cryptocurrencies like Bitcoin and Ethereum can often trigger downturns across the board, affecting altcoins like QNT.
- Profit-Taking: After periods of potential price appreciation, some investors may choose to take profits, leading to sell-offs and price corrections.
- Whale Activity: Large transactions by major holders (whales) can sometimes create significant price swings in the market.
- Project-Specific News: While not explicitly mentioned in the provided data, any project-specific news, announcements, or developments related to Quant could also impact investor sentiment and price action.
Is This a Buying Opportunity?
The question on many investors’ minds is whether this price dip presents a potential buying opportunity. While this analysis is not financial advice, here are some points to consider:
- DYOR (Do Your Own Research): Always conduct thorough research before making any investment decisions. Understand Quant’s fundamentals, technology, and long-term prospects.
- Long-Term Vision: Consider your investment horizon. Are you a short-term trader or a long-term holder? Price dips can be buying opportunities for long-term investors who believe in the project’s fundamentals.
- Risk Management: Cryptocurrency investments are inherently risky. Assess your risk tolerance and invest only what you can afford to lose.
- Market Analysis: Continue to monitor market trends, volatility, and trading volume to make informed decisions.
In Conclusion: Staying Informed in the Crypto Landscape
The recent price movement of Quant (QNT) underscores the dynamic and often unpredictable nature of the cryptocurrency market. By analyzing price trends, volatility, trading volume, and circulating supply, we can gain valuable insights into market dynamics. While short-term price fluctuations are common, a comprehensive understanding of these indicators, coupled with thorough research, empowers investors to navigate the crypto landscape more effectively. Staying informed and adaptable is key to making sound decisions in this ever-evolving digital asset class.
Disclaimer: The information provided is not trading advice, Bitcoinworld.co.in holds no liability for any investments made based on the information provided on this page. We strongly recommend independent research and/or consultation with a qualified professional before making any investment decisions.