Hold onto your hats, crypto enthusiasts! Solana (SOL) is making waves again, demonstrating impressive bullish momentum in the market. If you’ve been keeping an eye on the crypto charts, you’ll notice SOL flashing green, and for good reason. Let’s dive into the latest price action and what’s fueling this exciting surge.
Solana’s Price Momentum: A Deep Dive into the Green
As of today, Solana’s price has jumped by a significant 4.16% in the last 24 hours, pushing its value to $121.71. This upward trend is not just a fleeting moment; it’s part of a larger, more compelling story. Take a look at the price chart below to visualize this recent climb:
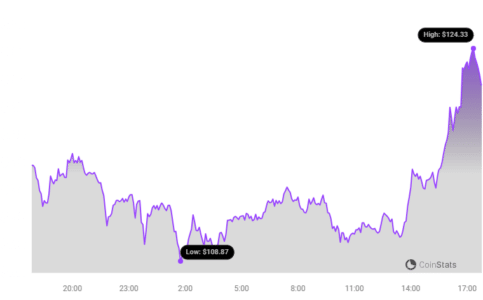
But the story doesn’t end with a single day’s gains. Zooming out to the past week reveals an even more impressive performance.
Weekly Performance: A Stunning 61% Uptick
Over the last seven days, Solana has experienced a remarkable uptick of over 61.0%! Starting from a price of $71.25, SOL has surged to its current level, showcasing strong investor confidence and market enthusiasm. This substantial increase highlights Solana’s resilience and growing appeal within the crypto space.
While currently trading at these exciting levels, it’s worth remembering Solana’s all-time high of $259.96. This historical peak serves as a reminder of SOL’s potential and the heights it has reached in the past. Could we see Solana challenging these levels again in the future?
Decoding Solana’s Price and Volatility
To better understand Solana’s recent price movements, let’s analyze its price action and volatility. The chart below provides a comparative view of Solana’s volatility over the past 24 hours versus the last week:
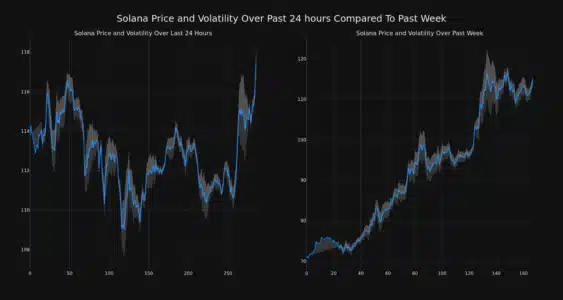
The visual representation uses Bollinger Bands (the gray bands) to illustrate volatility. Here’s a quick breakdown of what this means:
- Bollinger Bands as Volatility Indicators: These bands measure the degree of price fluctuation. Wider bands indicate higher volatility, meaning the price is experiencing larger swings. Conversely, narrower bands suggest lower volatility with more stable price movement.
- Daily vs. Weekly Volatility: By comparing the Bollinger Bands on the left (24 hours) and right (weekly), we can visually assess whether Solana’s price swings are more pronounced in the short-term or over the week.
- Interpreting the Gray Area: A larger gray area within the Bollinger Bands at any point signifies increased volatility during that period.
See Also: The Price Of XRP Increased More Than 3% Within 24 Hours
Trading Volume and Circulating Supply: Key Market Dynamics
Beyond price and volatility, understanding trading volume and circulating supply provides a more holistic view of Solana’s market health. Let’s examine these crucial indicators:
Trading Volume Surges
Interestingly, the trading volume for SOL has climbed by an impressive 90.0% over the past week. This significant increase suggests heightened market activity and investor interest in Solana. A surge in trading volume often accompanies price increases, indicating strong conviction behind the upward momentum.
Circulating Supply Slightly Decreases
In contrast to the rising trading volume, the circulating supply of Solana has slightly decreased by 0.38% over the past week. While seemingly small, a decrease in circulating supply, especially when coupled with rising demand (indicated by price and volume), can be a bullish signal. It implies that fewer SOL tokens are available in the market relative to the buying pressure.
The chart below visually represents the relationship between Solana’s circulating supply and trading volume:
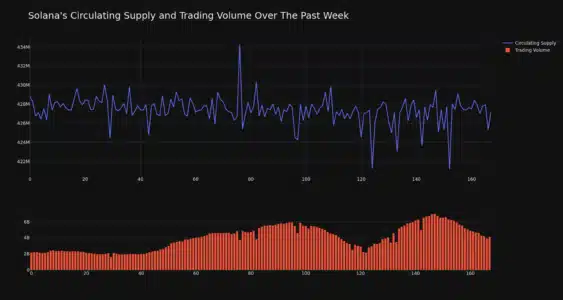
Currently, the circulating supply of SOL stands at 427.47 million tokens.
Solana’s Market Position: A Top Contender
With a current market capitalization of $50.09 billion, Solana firmly holds the #4 ranking in the cryptocurrency market. This prestigious position underscores Solana’s significance and influence within the digital asset landscape. Breaking into the top 5 cryptocurrencies is no small feat, and it reflects the robust ecosystem, technological advancements, and growing adoption of the Solana blockchain.
In Conclusion: Is Solana’s Bull Run Just Getting Started?
Solana’s recent price surge, coupled with a substantial weekly gain, increased trading volume, and a top market ranking, paints a bullish picture for the altcoin. While the cryptocurrency market is known for its volatility, Solana’s strong fundamentals and positive market indicators suggest that this upward trend could have further momentum. Keep a close watch on SOL as it continues to navigate the dynamic crypto landscape. Will it challenge its all-time highs? Only time will tell, but for now, Solana is definitely a cryptocurrency to watch!
Disclaimer: The information provided is not trading advice. Bitcoinworld.co.in holds no liability for any investments made based on the information provided on this page. We strongly recommend independent research and/or consultation with a qualified professional before making any investment decisions.
Disclaimer: The information provided is not trading advice, Bitcoinworld.co.in holds no liability for any investments made based on the information provided on this page. We strongly recommend independent research and/or consultation with a qualified professional before making any investment decisions.