Cryptocurrency markets are known for their volatility, and The Graph (GRT) is no exception. If you’re tracking your GRT holdings, you might have noticed a recent dip. Let’s break down the latest price action for The Graph and understand what’s been happening in the market.
GRT Price Overview: 24-Hour and Weekly Trends
Over the past 24 hours, the price of The Graph (GRT) has decreased by 7.23%, landing at $0.18. This continues a slight negative trend from the past week, where GRT has seen a 1.0% loss overall, starting from $0.18. While a 7.23% daily drop might sound alarming, it’s crucial to look at the broader context and understand the nuances of crypto market movements.
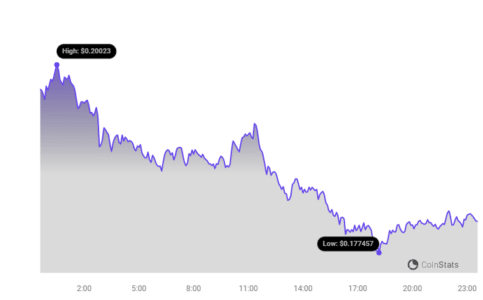
As you can see from the chart above, provided by Coinstats, visualizing price movements is key to understanding trends. But what does this price movement really tell us?
Volatility Check: Is GRT’s Price Action Unusual?
To get a better grasp of GRT’s price behavior, let’s look at volatility. Volatility in crypto refers to the degree of price fluctuations over time. High volatility means prices can swing dramatically, while low volatility suggests more stable price action.
The chart below uses Bollinger Bands (the gray bands) to illustrate GRT’s volatility over the last 24 hours (left) and the past week (right). Bollinger Bands widen when volatility increases and narrow when it decreases. A wider band indicates higher price fluctuation.
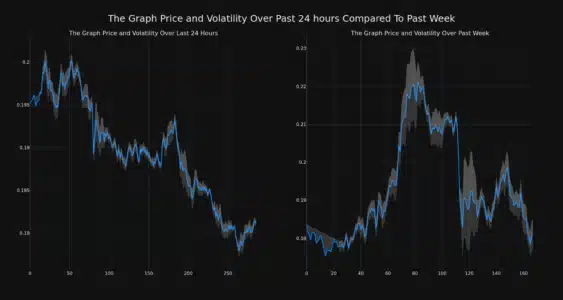
Analyzing these bands helps us understand if the recent price drop is accompanied by increased volatility, which is typical in market corrections, or if it’s a relatively stable downward trend.
Trading Volume and Circulating Supply: What’s the Connection?
Interestingly, while the price has dipped slightly over the past week, The Graph’s trading volume has actually increased by 17.0% during the same period. This means more GRT tokens are being traded, even as the price experiences a slight decline.
Furthermore, the circulating supply of GRT has also seen a minor increase of 0.15% in the last week. This directional movement of trading volume alongside circulating supply can offer insights into market dynamics.
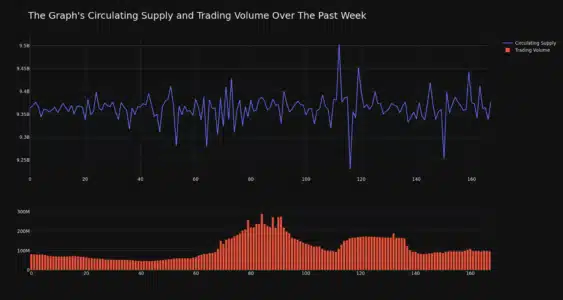
Currently, the circulating supply of GRT stands at 9.36 billion tokens. This represents a significant portion, approximately 86.8%, of its total maximum supply of 10.79 billion GRT.
GRT Market Cap and Ranking: Where Does it Stand?
Market capitalization, or market cap, is a crucial metric for understanding a cryptocurrency’s size and dominance. It’s calculated by multiplying the circulating supply by the current price. According to our latest data, The Graph’s current market cap is $1.70 billion, placing it at rank #48 among all cryptocurrencies.
This ranking indicates GRT’s position within the broader crypto ecosystem. While price fluctuations are normal, market cap and ranking provide a more stable, long-term perspective on a project’s value and adoption.
Understanding The Graph (GRT): What Does it Do?
For those new to The Graph, it’s essential to understand what this project is all about. The Graph is often described as the “Google of blockchains.” In simpler terms, it’s a decentralized indexing protocol that organizes blockchain data and makes it easily accessible through GraphQL.
Think of it this way: blockchains contain vast amounts of data, but accessing and querying this data efficiently can be challenging. The Graph solves this problem by indexing data from various blockchains like Ethereum and making it readily available for decentralized applications (dApps). This allows developers to build faster and more efficient dApps.
Key benefits of The Graph:
- Efficient Data Access: Provides quick and easy access to blockchain data for dApps.
- Decentralization: Offers a decentralized alternative to centralized data indexing solutions.
- Scalability: Designed to handle the growing volume of blockchain data.
- Empowering dApps: Enables developers to create richer and more responsive decentralized applications.
Navigating GRT Price Fluctuations: Key Takeaways
While the recent price dip in GRT might cause short-term concern, it’s crucial to remember that price volatility is inherent in the cryptocurrency market. Here are some key points to consider:
- Market Corrections are Normal: Price drops are a regular part of market cycles. It’s important not to panic sell based on short-term fluctuations.
- Look Beyond Price: Analyze other metrics like trading volume, market cap, and project fundamentals to get a holistic view.
- Understand the Project: Investing in crypto requires understanding the underlying technology and its potential. The Graph plays a vital role in the Web3 ecosystem.
- Do Your Own Research (DYOR): Always conduct thorough research before making any investment decisions in crypto.
See Also: The Price Of Sei (SEI) Decreased More Than 10% Within 24 Hours
In Conclusion: Staying Informed in the GRT Market
The Graph (GRT) has experienced a recent price decrease, but understanding the context behind these movements is crucial. By analyzing volatility, trading volume, circulating supply, and market capitalization, we can gain a more informed perspective on GRT’s market position. Remember to stay updated on market trends, understand the fundamentals of projects like The Graph, and always conduct your own research before making any investment decisions in the dynamic world of cryptocurrency.
Disclaimer: The information provided is not trading advice. Bitcoinworld.co.in holds no liability for any investments made based on the information provided on this page. We strongly recommend independent research and/or consultation with a qualified professional before making any investment decisions.
Disclaimer: The information provided is not trading advice, Bitcoinworld.co.in holds no liability for any investments made based on the information provided on this page. We strongly recommend independent research and/or consultation with a qualified professional before making any investment decisions.