Is TRON (TRX) catching the crypto wave? If you’re keeping an eye on the crypto markets, you might have noticed TRON (TRX) making some moves. Over the last 24 hours, TRX has experienced a notable 3.22% jump in price, currently sitting at $0.107. But is this just a blip, or is there more to this upward trend? Let’s dive into the data and see what’s driving TRON’s recent performance.
TRX Price Momentum: A Week in Review
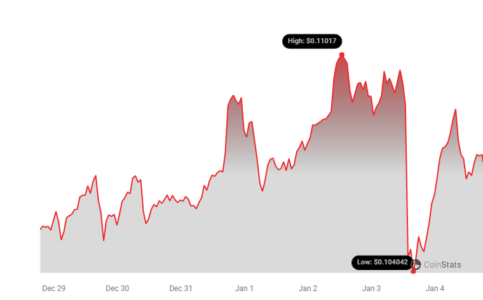
Looking beyond just the last day, TRON’s positive trajectory becomes even clearer. Over the past week, TRX has shown a consistent uptick of over 2.0%. It climbed from a price point of $0.10 to where it stands today. While this might seem modest, in the volatile world of crypto, steady growth is often a welcome sign. For context, it’s worth remembering that TRX once hit an all-time high of $0.23. While still some distance from that peak, the recent momentum is definitely something for TRX enthusiasts to watch.
Decoding Volatility: What Do the Charts Tell Us About TRON?
To get a clearer picture of TRON’s price action, charts are our best friend. The following chart gives us a visual comparison of TRX’s price movement and volatility over two key periods:
- Past 24 Hours (Left Chart): Shows intraday price fluctuations and volatility.
- Past Week (Right Chart): Illustrates the broader weekly trend and overall volatility.
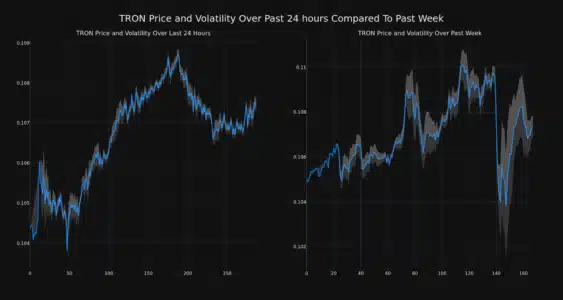
Notice those gray bands in the charts? Those are Bollinger Bands, a popular tool used by traders to measure volatility. Think of them as dynamic ranges that adapt to price movements. Here’s a simple breakdown of what they indicate:
- Wider Bands = Higher Volatility: When the gray bands widen, it signals increased price swings and greater uncertainty in the market.
- Narrower Bands = Lower Volatility: Conversely, narrower bands suggest price stability and less dramatic fluctuations.
By examining the Bollinger Bands on the charts, you can quickly assess whether TRON is experiencing a period of high or low volatility in both the short-term (daily) and medium-term (weekly).
See Also: Tron Founder, Justin Sun, Reportedly Moves Millions in USDT to Binance
Trading Volume and Circulating Supply: Key Indicators for TRX
Price movements are only part of the story. To get a more holistic view of TRON’s market health, we need to consider other important metrics like trading volume and circulating supply.
- Trading Volume Surge: Excitingly, TRON’s trading volume has climbed by 10.0% over the past week. This increase suggests heightened interest and activity around TRX. A rising trading volume often accompanies positive price movements, indicating stronger market participation.
- Circulating Supply Growth: In tandem with the increased trading volume, TRON’s circulating supply has also seen a modest increase of 0.57%. Circulating supply refers to the total number of TRX coins that are currently available to be traded in the market.
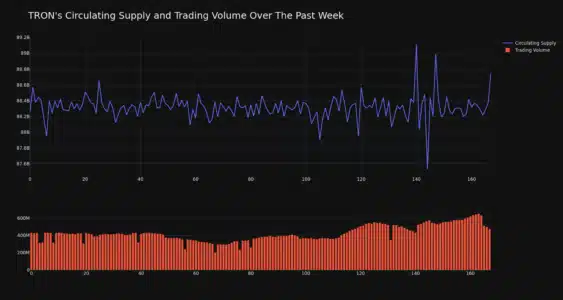
Currently, the circulating supply of TRX stands at 88.30 billion coins. This figure is important because it, along with the current price, determines the market capitalization of TRON.
TRON’s Market Cap Ranking: Where Does TRX Stand?
Market capitalization, or market cap, is essentially the total value of a cryptocurrency. It’s calculated by multiplying the current price of a coin by its circulating supply. Market cap ranking provides a sense of a cryptocurrency’s size and dominance within the overall crypto market.
According to the latest data, TRON’s market cap ranking is currently #13, with a market cap of $9.51 billion. Being in the top 15 cryptocurrencies by market cap highlights TRON’s significant position and established presence in the crypto space.
In Conclusion: Is TRON Poised for Further Growth?
TRON (TRX) is showing signs of positive momentum with recent price increases, a surge in trading volume, and a healthy market cap ranking. While the crypto market is inherently volatile and past performance is not indicative of future results, these indicators suggest renewed interest and potential for further growth in TRX. Keep an eye on TRON as it continues to navigate the dynamic crypto landscape!
Disclaimer: The information provided is not trading advice. Bitcoinworld.co.in holds no liability for any investments made based on the information provided on this page. We strongly recommend independent research and/or consultation with a qualified professional before making any investment decisions.
Disclaimer: The information provided is not trading advice, Bitcoinworld.co.in holds no liability for any investments made based on the information provided on this page. We strongly recommend independent research and/or consultation with a qualified professional before making any investment decisions.