Cryptocurrency markets are known for their rollercoaster rides, and today, Sei (SEI) is experiencing a downward turn. After a week of impressive gains, SEI’s price has taken a dip, sparking questions among investors. Let’s delve into the recent price action of SEI, analyze the factors at play, and see what the charts are telling us.
SEI Price Plummets 10% in 24 Hours: What’s Behind the Drop?
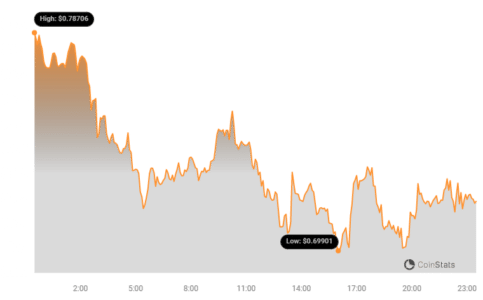
Currently, the price of SEI stands at $0.71, marking a significant 10.16% decrease in the last 24 hours. This sudden downturn might be concerning for those holding SEI, especially after a week of positive momentum.
However, before jumping to conclusions, it’s crucial to zoom out and look at the bigger picture.
Weekly Uptrend Still Intact: A Temporary Setback or a Trend Reversal?
While the daily drop is noticeable, it’s important to remember that SEI has been on a strong uptrend over the past week. The price has risen by 23.0%, climbing from $0.58 to its current level. This positive weekly performance suggests that the current dip might be a temporary correction within a larger bullish trend.
Think of it like this: even in a healthy bull market, we often see pullbacks. These pullbacks can be caused by various factors, including profit-taking after a price surge, broader market sentiment shifts, or specific news events related to the cryptocurrency.
Volatility Check: Is SEI’s Price Action Normal?
To understand the significance of these price swings, let’s look at volatility. Volatility measures how much the price of an asset fluctuates over time. Cryptocurrencies, in general, are known for their higher volatility compared to traditional assets, and SEI is no exception.
The chart below uses Bollinger Bands to visualize SEI’s price volatility over the last 24 hours and the past week.
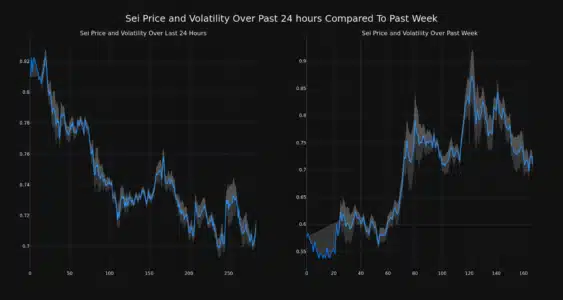
Understanding Bollinger Bands:
- The gray bands in the chart are Bollinger Bands.
- They act as volatility indicators, showing the range within which SEI’s price typically moves.
- Wider bands indicate higher volatility, meaning the price is swinging more dramatically.
- Conversely, narrower bands suggest lower volatility, with prices moving more steadily.
By examining the Bollinger Bands, we can get a sense of whether the current price fluctuations are within the normal volatility range for SEI or if they are unusually extreme.
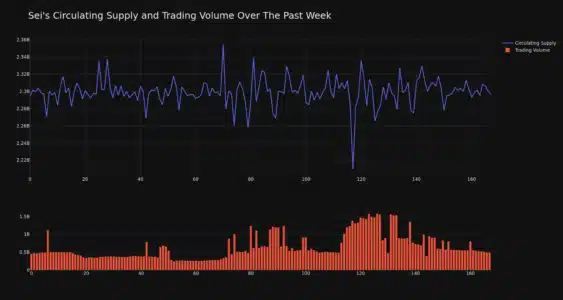
Trading Volume and Circulating Supply: What Do They Tell Us?
Beyond price and volatility, other key metrics provide insights into SEI’s market dynamics:
- Trading Volume: The trading volume for SEI has increased by 7.0% over the past week. A rise in trading volume often accompanies price movements, indicating increased market activity and interest in the coin.
- Circulating Supply: The circulating supply of SEI has slightly increased by 0.1% to over 2.30 billion coins. Circulating supply refers to the number of coins available for public trading. Changes in circulating supply can sometimes influence price, although a 0.1% increase is relatively minor.
SEI’s Market Cap and Ranking: Where Does It Stand?
Currently, SEI holds the #49 market cap ranking, with a market capitalization of $1.66 billion. Market cap is calculated by multiplying the circulating supply by the current price and is a common way to gauge the size and relative importance of a cryptocurrency. A ranking of #49 places SEI among the top altcoins in the crypto market.
See Also: The Price Of Toncoin (TON) Fell More Than 3% Within 24 Hours
Concluding Thoughts: Navigating SEI’s Price Swings
SEI’s recent 10% price drop highlights the inherent volatility of the cryptocurrency market. While the daily downturn might cause short-term concern, the context of a strong weekly uptrend and increased trading volume suggests that this could be a temporary pullback rather than a major trend reversal.
For investors, it’s crucial to conduct thorough research, consider both short-term fluctuations and long-term trends, and understand risk tolerance. Analyzing metrics like volatility, trading volume, and market cap, alongside price charts, can provide a more comprehensive understanding of SEI’s market position.
Remember to stay informed and make investment decisions based on your own research and financial situation.
Disclaimer: The information provided is not trading advice. Bitcoinworld.co.in holds no liability for any investments made based on the information provided on this page. We strongly recommend independent research and/or consultation with a qualified professional before making any investment decisions.
Disclaimer: The information provided is not trading advice, Bitcoinworld.co.in holds no liability for any investments made based on the information provided on this page. We strongly recommend independent research and/or consultation with a qualified professional before making any investment decisions.