Hold onto your hats, crypto enthusiasts! The rollercoaster ride of the crypto market continues, and TRON (TRX) is feeling the bumps. While the crypto world is known for its volatility, recent trends are painting a clear picture of shifting investor sentiment. Let’s dive deep into the latest data surrounding TRON’s trading volume and see what’s driving the current market narrative.
TRON (TRX) Trading Volume: A Tale of Two Quarters
The first quarter of 2022 witnessed a significant dip in TRX trading volume compared to the same period last year. In simple terms, there’s been a noticeable decrease in the amount of TRX being bought and sold. Let’s break down the numbers to get a clearer picture:
- Q1 2021 Trading Volume: A whopping $186.45 billion
- Q1 2022 Trading Volume: Significantly lower at $91.57 billion
That’s roughly a 50% decrease! Quite a drop, right? But what’s behind this dramatic shift? The primary culprit seems to be the prevailing bearish trend that has gripped the broader cryptocurrency market. This extended period of market downturn has understandably dampened investor enthusiasm across the board, and TRON is no exception.
Essentially, when the overall crypto market mood turns sour, like it has for a significant portion of the recent period, most cryptocurrencies, including TRX, experience a decrease in trading activity. Think of it like this: when the weather is gloomy, fewer people go out for a walk in the park.
To illustrate this further, here’s a month-by-month comparison of TRX trading volume in Q1 2021 and Q1 2022:
| Month | Q1 2021 Trading Volume | Q1 2022 Trading Volume |
| January | $47.45 Billion (Daily High: $4.82 Billion) | $34.54 Billion (Daily High: $1.85 Billion) |
| February | $69.73 Billion (Daily High: $4.20 Billion) | $28.02 Billion (Daily High: $1.43 Billion) |
| March | $69.27 Billion (Daily High: $11.94 Billion) | $29.02 Billion (Daily High: $2.06 Billion) |
Source : Coinranking
Flight to Safety: Stablecoins and TRX
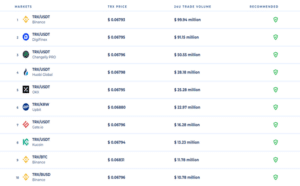
Interestingly, the data reveals that when TRX is traded against other digital currencies, the most popular pairings in Q1 2022 were with stablecoins like Tether (USDT) and Binance USD (BUSD). What does this tell us?
This trend suggests that investors are increasingly seeking refuge in the relative stability of stablecoins during market downturns. By pairing TRX with USDT or BUSD, investors are likely attempting to protect their crypto holdings from the high volatility and potential losses associated with bearish market conditions. It’s like moving your money into a safer account when the stock market gets shaky.
TRX Price Performance: Q1 2022 vs. Q1 2021
Now, let’s shift our focus to how TRX’s price reacted during these periods. Did the price movement mirror the trading volume trends?
Q1 2022: Price Stability Amidst Volume Decline
Despite the significant drop in trading volume, TRX price movement in Q1 2022 was relatively muted. Here’s a quick snapshot:
- Opening Price (Jan 1, 2022): $0.0754
- Quarterly High (March 31, 2022): $0.0793
- Closing Price (March 31, 2022): $0.07388
Overall, the price difference between the start and end of Q1 2022 was a mere 2% increase. This suggests that while trading activity slowed down, TRX managed to maintain a degree of price stability.
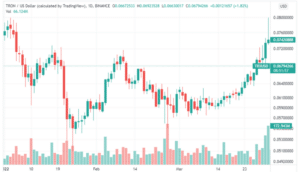
Source: TradingView
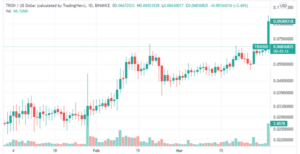
Q1 2021: A Bullish Surge
Contrast this with Q1 2021, which painted a vastly different picture. The crypto market was in a bullish phase, and TRX price action reflected this positive sentiment:
- Opening Price (Jan 1, 2021): $0.02683
- Quarterly High: $0.09679
- Closing Price (March 31, 2021): $0.09231
The difference here is striking! TRX experienced a massive 244% increase between its opening and closing prices in Q1 2021. This significant price appreciation was fueled by the overall bullish market momentum and increased investor appetite for cryptocurrencies.
Key Takeaways and What to Watch For
The data clearly indicates a significant shift in investor behavior towards TRON between Q1 2021 and Q1 2022. The substantial decrease in trading volume, coupled with the preference for stablecoin pairings, points towards a risk-off sentiment prevailing in the market. While TRX price demonstrated resilience in Q1 2022 despite the volume drop, the stark contrast with the bullish price surge of Q1 2021 highlights the impact of overall market conditions.
What does this mean for crypto traders and TRON enthusiasts?
- Market Sentiment Matters: The broader crypto market sentiment plays a crucial role in the trading volume and price action of individual cryptocurrencies like TRX.
- Stablecoins as Safe Havens: During bear markets, stablecoins tend to become more attractive as investors seek to preserve capital.
- TRX Resilience: Despite the bearish conditions, TRX showed price stability in Q1 2022, suggesting underlying strength and community support.
As we move forward, it will be crucial to monitor the overall crypto market trends, TRON’s development activities, and shifts in investor sentiment to gain a clearer understanding of TRX’s future trajectory. Will TRX regain its trading volume momentum when the market turns bullish? Only time will tell. Stay tuned for more crypto market insights!
Related Posts – Elon Musk, a Dogecoin supporter, has decided not to join the Twitter board of directors
Disclaimer: The information provided is not trading advice, Bitcoinworld.co.in holds no liability for any investments made based on the information provided on this page. We strongly recommend independent research and/or consultation with a qualified professional before making any investment decisions.