Hey crypto enthusiasts! Feeling the buzz around TRON (TRX)? You’re not alone! TRX has been making waves in the market lately, and if you’re keeping an eye on your portfolio (or thinking about jumping in), you’ll want to know what’s driving this momentum. Let’s dive into the latest TRON (TRX) price analysis and see what’s fueling its recent surge.
TRON (TRX) Price Jumps: What’s Happening?
In the past 24 hours, TRON (TRX) has experienced a notable increase, climbing by 3.29% to reach $0.12. That’s a significant move in a single day! But the positive trend doesn’t stop there.
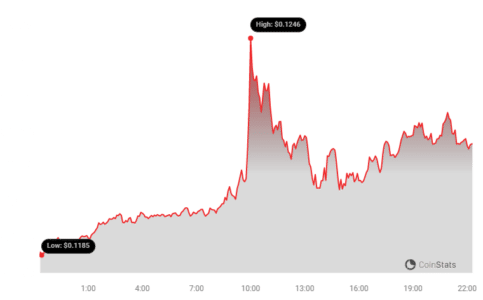
Looking at the bigger picture, over the last week, TRON has shown even stronger performance. We’ve seen an uptick of over 8.0%, with the price climbing from $0.11 to its current level. This consistent upward movement is definitely catching the attention of traders and investors alike.
For context, TRON’s historical peak stands at $0.23. While it’s still below its all-time high, the recent gains suggest a potential for further growth.
Decoding TRX Volatility: Is it Getting Bumpy?
To understand the stability and risk associated with TRX, let’s look at volatility. Volatility essentially measures how much the price of an asset fluctuates over time. High volatility can mean bigger potential gains, but also greater risks. The chart below gives us a visual representation of TRON’s price movement and volatility, comparing the past 24 hours to the last week.
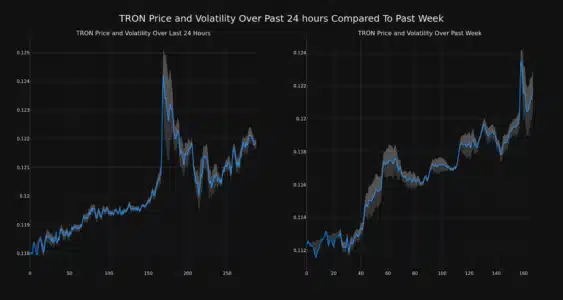
Notice those gray bands in the charts? Those are Bollinger Bands, a popular tool used to measure volatility.
Understanding Bollinger Bands:
- Bollinger Bands consist of a middle band (usually a simple moving average) and two outer bands that are calculated based on the standard deviation of the price.
- Wider Bands = Higher Volatility: When the bands widen, it indicates increased price fluctuations and higher volatility.
- Narrower Bands = Lower Volatility: Conversely, narrower bands suggest lower volatility and more stable price movement.
By observing the Bollinger Bands in the charts, you can get a sense of whether TRX is experiencing high or low volatility in both the short-term (24 hours) and medium-term (weekly).
Trading Volume & Circulating Supply: What Do They Tell Us About TRX?
Beyond price and volatility, two other key metrics can offer insights into the health and momentum of TRON: trading volume and circulating supply.
Here’s what’s happening with these indicators for TRX:
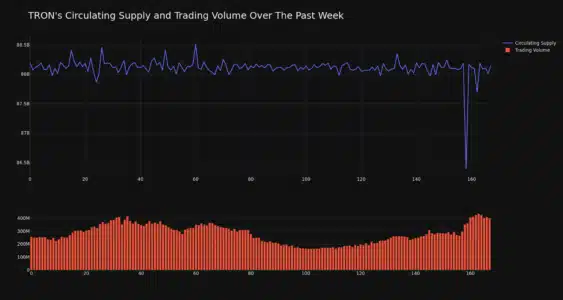
- Trading Volume Surge: Over the past week, the trading volume for TRX has climbed by a significant 56.0%. This surge in trading activity often indicates increased interest and participation in the market for TRX. It can be a sign of growing bullish sentiment or increased speculative trading.
- Circulating Supply Slight Decrease: Interestingly, the circulating supply of TRX has decreased slightly by 0.05% over the same period. A decrease in circulating supply, while demand remains constant or increases, can sometimes put upward pressure on the price.
Currently, the circulating supply of TRX stands at 88.10 billion coins. This is a significant number, reflecting TRON’s design as a high-throughput blockchain platform.
TRX Market Cap and Ranking: Where Does TRON Stand?
Market capitalization (market cap) is a crucial metric for understanding the overall size and dominance of a cryptocurrency. It’s calculated by multiplying the circulating supply by the current price.
As per our latest data, TRON (TRX) holds a market cap ranking of #13, with a market cap of approximately $10.73 billion. Breaking into the top 15 cryptocurrencies by market cap is a testament to TRON’s established position and market presence within the crypto ecosystem.
What does a #13 ranking mean?
- Established Player: A ranking in the top 15 signifies that TRON is not a new or obscure project. It’s a well-established cryptocurrency with a significant community and ecosystem.
- Liquidity and Accessibility: High market cap coins generally enjoy greater liquidity on exchanges, making them easier to buy and sell.
- Investor Confidence: A strong market cap can reflect investor confidence in the long-term viability and potential of the project.
TRON (TRX): What’s Next?
TRON’s recent price surge and positive market indicators are certainly encouraging for TRX holders. The increased trading volume and price appreciation suggest growing interest in the cryptocurrency. However, the crypto market is known for its volatility, and it’s essential to approach any investment with caution and conduct thorough research.
Key Takeaways from this TRON (TRX) Analysis:
- Positive Price Momentum: TRX has shown strong price gains in the past 24 hours and week.
- Increased Volatility: Keep an eye on volatility, as indicated by Bollinger Bands, to understand potential price swings.
- Surging Trading Volume: Increased trading volume often signals growing market interest.
- Solid Market Ranking: TRON’s #13 market cap ranking highlights its position as a significant cryptocurrency.
Disclaimer:
Disclaimer: The information provided is not trading nor financial advice. Bitcoinworld.co.in holds no liability for any trading or investments made based on the information provided on this page. We strongly recommend independent research and/or consultation with a qualified professional before making any trading or investment decisions.
#Binance #WRITE2EARN
Disclaimer: The information provided is not trading advice, Bitcoinworld.co.in holds no liability for any investments made based on the information provided on this page. We strongly recommend independent research and/or consultation with a qualified professional before making any investment decisions.