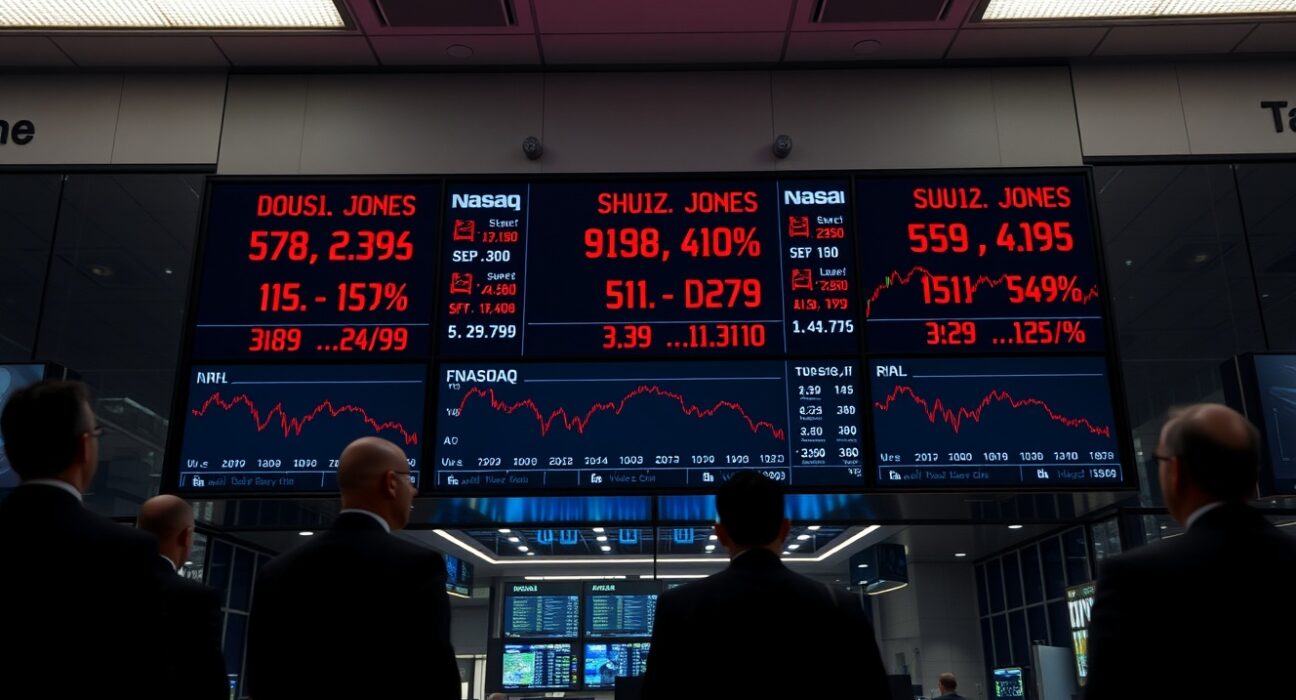
In a notable shift from recent trading patterns, U.S. equity markets opened decisively lower on Wednesday, March 12, 2025, signaling a broad-based retreat across major indices. The Dow Jones Industrial Average, S&P 500, and Nasdaq Composite all recorded significant early-session losses, sparking immediate analysis from market participants regarding the potential drivers behind the sudden downward pressure. This opening move establishes a cautious tone for the trading day and follows a period of notable volatility in global financial markets.
US Stocks Open Lower: Analyzing the Early Session Data
The opening bell on Wall Street ushered in a wave of selling pressure. Consequently, all three primary U.S. stock benchmarks opened in negative territory. Specifically, the Dow Jones Industrial Average fell by 0.99% at the open. Meanwhile, the broader S&P 500 index declined by 0.79%. Similarly, the technology-heavy Nasdaq Composite dropped 0.89%. This synchronized decline suggests a market-wide reaction rather than sector-specific concerns. Historically, openings of this magnitude often set the tone for the session’s trading activity. Market analysts immediately began scrutinizing pre-market futures and overseas trading for clues.
To provide clear context, the table below details the precise opening movements:
| Index | Opening Change |
|---|---|
| S&P 500 | -0.79% |
| Nasdaq Composite | -0.89% |
| Dow Jones Industrial Average | -0.99% |
These figures represent the most immediate snapshot of market sentiment. Furthermore, they reflect the first executable prices for a large volume of orders. The uniformity of the decline across diverse indices is a key point of analysis.
Potential Catalysts for the Market Decline
Financial experts routinely examine several factors when markets open lower. Firstly, macroeconomic data releases often act as triggers. For instance, stronger-than-expected inflation or employment reports can alter interest rate expectations. Secondly, geopolitical developments create uncertainty that markets typically dislike. Thirdly, corporate earnings disappointments from key bellwether companies can have an outsized impact. Finally, movements in the bond market frequently influence equity valuations. A sharp rise in Treasury yields, for example, can make stocks less attractive by comparison.
Market technicians also watch key support levels. A break below these levels can trigger automated selling programs. Additionally, sector rotation—where money flows out of one industry group into another—can cause broad index movements. The opening decline may also represent a reaction to overnight trading in Asian and European markets. Global markets are deeply interconnected in the modern financial system.
Historical Context and Market Psychology
Periodic pullbacks are a normal feature of long-term bull markets. According to data from CFRA Research, the S&P 500 experiences an average intra-year decline of approximately 14.3%. However, the index has ended the year in positive territory in 75% of calendar years since 1945. Therefore, a single down opening, while noteworthy, requires broader context. Investor psychology plays a crucial role. Sentiment indicators, such as the CNN Fear & Greed Index, provide insight into whether the market is driven by fear or optimism. A shift toward fear can often precede or accompany a sell-off.
The velocity of the decline matters as well. A rapid, high-volume sell-off differs fundamentally from a slow, grinding descent. The former often indicates panic or forced liquidation. The latter may suggest a more deliberate reassessment of valuations. Trading volume in the first hour is a critical metric for analysts. It helps distinguish between a minor adjustment and the start of a more significant trend.
Sector Performance and Leading Contributors
While the headline indices provide a top-level view, sector performance reveals the story beneath the surface. On days when US stocks open lower, certain sectors often lead the decline. Cyclical sectors like industrials, materials, and financials are typically more sensitive to economic growth fears. Conversely, defensive sectors such as utilities and consumer staples may show relative strength. Technology stocks, which carry substantial weight in the S&P 500 and dominate the Nasdaq, are particularly sensitive to changes in interest rate expectations.
Identifying the largest point contributors to the Dow’s decline is a standard analytical practice. A drop in a high-priced stock like UnitedHealth Group or Goldman Sachs has a disproportionate impact on the price-weighted Dow. In contrast, the S&P 500 is market-cap weighted, so a decline in mega-cap companies like Apple, Microsoft, or Nvidia would have a greater effect. This distinction explains why the percentage moves of the two indices can differ even on the same trading day.
The Role of Monetary Policy and Economic Data
The Federal Reserve’s policy stance remains a primary driver of market direction. Speeches from Fed officials, minutes from policy meetings, and projections for future rate moves are closely parsed by investors. Any hint of a more aggressive tightening posture than previously anticipated can cause immediate market repricing. Similarly, key economic indicators like the Consumer Price Index (CPI), Producer Price Index (PPI), and monthly jobs report directly influence policy expectations. A hotter-than-expected reading can spark fears of prolonged higher interest rates, which compress equity valuations.
Furthermore, the shape of the Treasury yield curve is a renowned recession indicator. An inversion of the curve, where short-term yields exceed long-term yields, has preceded every U.S. recession since 1955. While not a timing tool, a deeply inverted curve contributes to a risk-off sentiment among institutional investors. This sentiment can manifest as a lower opening for stocks as capital seeks safer assets.
Global Market Correlations and External Pressures
U.S. markets do not operate in a vacuum. Significant moves in European bourses like the FTSE 100, DAX, and CAC 40 often presage the tone for Wall Street. Asian markets, particularly Japan’s Nikkei 225 and Hong Kong’s Hang Seng Index, close hours before the U.S. open. Their performance provides an early read on global risk appetite. A sell-off in China, for example, can ripple through commodity markets and impact related U.S. stocks. Additionally, currency fluctuations, especially in the U.S. Dollar Index (DXY), affect multinational corporate earnings. A strong dollar can hurt the overseas revenue of S&P 500 companies when converted back to USD.
Commodity prices also serve as economic barometers. A sharp drop in industrial metals like copper may signal concerns about global manufacturing demand. Conversely, a spike in crude oil prices can stoke inflation fears and hurt consumer discretionary spending. These complex intermarket relationships are constantly at play, influencing the opening print for US stocks.
Conclusion
The lower opening for US stocks, marked by declines in the Dow, S&P 500, and Nasdaq, represents a clear shift in near-term market sentiment. While a single session’s opening move is just one data point, it occurs within a broader framework of economic indicators, corporate fundamentals, and monetary policy. Investors and analysts will monitor the market’s ability to find support and gauge whether the early selling represents a temporary adjustment or the beginning of a deeper correction. Understanding the multifaceted reasons why US stocks open lower is essential for navigating modern financial markets with context and perspective.
FAQs
Q1: What does it mean when US stocks open lower?
It means the first traded prices of the day for major market indices like the S&P 500 are below the previous day’s closing price. This indicates immediate selling pressure and often reflects negative news or sentiment that developed after the prior close or in overseas markets.
Q2: How much did the Dow Jones drop at the open?
On this specific trading day, the Dow Jones Industrial Average opened 0.99% lower than its previous closing level.
Q3: Can the market recover after a lower open?
Yes, absolutely. The opening price is just the first transaction. Markets frequently reverse direction throughout the trading session based on news flow, economic data releases, and shifting investor sentiment. A “lower open” does not predetermine the closing price.
Q4: What are common reasons for a lower open?
Common catalysts include worse-than-expected economic data, geopolitical tensions, disappointing earnings from major companies, hawkish comments from central bankers, a sharp rise in bond yields, or significant declines in foreign stock markets that trade earlier.
Q5: Should individual investors be worried about a lower open?
A single lower opening is a normal market occurrence. Long-term investors are generally advised to focus on their overall financial plan and asset allocation rather than reacting to daily volatility. However, understanding the context behind the move is part of staying informed.
Disclaimer: The information provided is not trading advice, Bitcoinworld.co.in holds no liability for any investments made based on the information provided on this page. We strongly recommend independent research and/or consultation with a qualified professional before making any investment decisions.