
Ethereum, the second-largest cryptocurrency by market capitalization, has recently experienced a price correction, leaving many investors wondering about its next move. After struggling to overcome the $2,800 resistance barrier, ETH has entered a downtrend, breaching crucial support levels. Let’s dive into a detailed analysis of the current situation and explore what the future might hold for Ethereum.
Ethereum’s Price Action: What Happened?
The past few days have been challenging for Ethereum bulls. After several attempts to push through the $2,800 mark, ETH faced strong rejection. This rejection triggered a significant sell-off, driving the price below the critical $2,650 support level. This breach signaled a shift in momentum, handing control to the bears.
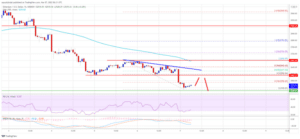
The downward pressure intensified, leading to Ethereum dropping below $2,550 and even testing the $2,500 support zone. This move below the 100 hourly simple moving average further confirmed the bearish trend in the short term. A low was formed near $2,508, and currently, Ethereum is consolidating its losses, attempting to find a footing.
Key Resistance Levels: Where Could Ethereum Face Hurdles?
For Ethereum to reverse its current downtrend, it needs to overcome several resistance levels. Let’s pinpoint the key areas where ETH might encounter selling pressure:
- $2,550: This level acts as the immediate short-term resistance. Breaking above this could signal a potential for further upward movement.
- $2,600 – $2,620: This zone represents a more significant resistance area. It aligns with:
- The previous breakdown zone (where the price initially started to fall).
- The 50% Fibonacci retracement level of the recent drop from $2,684 to $2,508.
- A connecting negative trend line forming on the hourly ETH/USD chart.
- $2,650: This level, combined with the 100 hourly simple moving average, presents a strong resistance. Overcoming this could indicate a more substantial shift in momentum.
- $2,800: This remains the major resistance zone that Ethereum has been struggling to breach. A successful break above $2,800 would be a bullish signal, potentially opening the door for further gains.
Fibonacci Retracement Explained: In technical analysis, Fibonacci retracement levels are horizontal lines that indicate potential areas of support and resistance. They are based on the Fibonacci sequence and are often used to predict the extent of possible pullbacks or bounces in price. In this context, the 23.6% and 50% Fibonacci retracement levels are being watched to identify potential resistance points for Ethereum’s price recovery.
Support Levels: Where Could Ethereum Find a Base?
On the downside, Ethereum needs to hold crucial support levels to prevent further declines. Here are the key support zones to watch:
- $2,510: This is the immediate support level. A hold above this is crucial in the short term.
- $2,500: This is a more significant psychological and technical support level. If ETH breaks below $2,500, it could trigger further selling pressure.
- $2,400: Below $2,500, the next major support zone lies around $2,400. A drop to this level is possible if bearish momentum continues.
- $2,300: Further losses could potentially lead to a move towards the $2,300 mark, representing a deeper correction.
Ethereum Price Prediction: Will ETH Recover or Fall Further?
The immediate future of Ethereum’s price action hinges on whether it can break above the $2,650 resistance zone.
Bullish Scenario: If Ethereum manages to initiate a new uptrend and decisively break above $2,650, we could see a push towards the $2,800 resistance. Overcoming $2,800 would be a strong bullish signal, potentially paving the way for a retest of higher price levels.
Bearish Scenario: However, if Ethereum fails to break above $2,650 and faces rejection at the resistance levels mentioned earlier, the downtrend could continue. A break below the $2,500 support could accelerate the decline, potentially leading to tests of the $2,400 and even $2,300 levels.
Factors Influencing Ethereum’s Price
While technical analysis provides valuable insights into potential price movements, it’s also important to consider the broader factors that can influence Ethereum’s price:
- Overall Crypto Market Sentiment: Ethereum’s price is often correlated with the overall sentiment in the cryptocurrency market. Positive market sentiment, often driven by Bitcoin’s performance, can boost ETH, while negative sentiment can drag it down.
- Ethereum Network Developments: Progress on Ethereum 2.0, including the ongoing transition to Proof-of-Stake and scalability improvements, can positively impact investor confidence and ETH’s price. Delays or setbacks can have the opposite effect.
- Adoption and Use Cases: Increasing adoption of Ethereum for decentralized applications (dApps), DeFi (Decentralized Finance), and NFTs (Non-Fungible Tokens) strengthens its utility and can drive demand for ETH.
- Regulatory Landscape: Regulatory developments concerning cryptocurrencies globally can significantly impact market sentiment and prices. Clarity and favorable regulations can be bullish, while stricter regulations or bans can be bearish.
- Macroeconomic Factors: Broader economic factors, such as inflation, interest rates, and global economic growth, can also influence investment decisions and impact the cryptocurrency market, including Ethereum.
Trading Ethereum: Key Takeaways for Crypto Traders
For crypto traders navigating the current Ethereum market, here are some key points to consider:
- Monitor Support and Resistance Levels: Pay close attention to the support and resistance levels outlined above. These levels can provide potential entry and exit points for trades.
- Stay Updated on Market News: Keep abreast of the latest news and developments in the crypto market, particularly those related to Ethereum and Ethereum 2.0.
- Manage Risk: Cryptocurrency trading is inherently risky. Always practice proper risk management techniques, such as using stop-loss orders and diversifying your portfolio.
- Consider Dollar-Cost Averaging (DCA): In volatile markets, DCA can be a strategy to mitigate risk by averaging your entry price over time.
- Use Technical Analysis Tools: Utilize technical analysis tools and charts to identify trends and potential trading opportunities.
Conclusion: Navigating Ethereum’s Price Volatility
Ethereum is currently experiencing a period of price volatility after failing to break through the $2,800 resistance. While the short-term outlook appears bearish, the cryptocurrency market is dynamic, and things can change rapidly. Traders and investors should closely monitor price action around the key support and resistance levels, stay informed about market developments, and exercise caution in their trading strategies. Whether ETH will rebound or face further declines remains to be seen, but understanding the technical landscape and broader market factors will be crucial for navigating the weeks ahead.
Disclaimer: This analysis is for informational purposes only and should not be considered financial advice. Cryptocurrency trading involves substantial risk, and you should always conduct your own research and consult with a qualified financial advisor before making any investment decisions.
Related Posts : The Brazilian Senate is set to vote on a crypto regulation bill
Disclaimer: The information provided is not trading advice, Bitcoinworld.co.in holds no liability for any investments made based on the information provided on this page. We strongly recommend independent research and/or consultation with a qualified professional before making any investment decisions.