
Just when crypto enthusiasts thought the weekend might bring some relief, the bears roared back. Bitcoin, after a brief Saturday recovery, took a sharp 4% dive on Sunday, crashing below the critical $56,000 mark. This sudden downturn has not only erased any hopes of a bullish week but has also dragged the entire crypto market back into a sea of red. The early hours of Monday in Asian trading are showing no signs of respite, with increasing supply further fueling the downward pressure. Are we witnessing just a minor setback, or is this the prelude to a more significant crypto crash? Let’s dive into the details.
Bitcoin’s Price Plunge: What’s Happening?
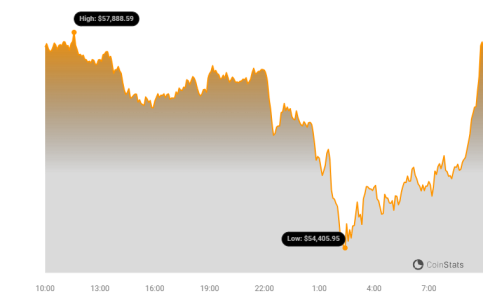
Currently, Bitcoin is trading around $55,269, marking a 1.30% intraday loss and hitting a low of $54,296. This bearish momentum is casting a long shadow over the altcoin market. Across the board, top cryptocurrencies are feeling the heat, with many experiencing losses of 5% or more. The mood is decidedly somber, with the dreaded ‘Monday Blues’ amplified by fears of further market decline.
Here’s a quick snapshot of how some major cryptocurrencies are performing:
- Bitcoin (BTC): Down by approximately 5% in the last 24 hours, currently trading around $55,269.
- Ethereum (ETH): Experiencing a significant drop of 5.25%.
- Solana (SOL): Taking a bigger hit with a 7.23% decrease.
- Toncoin (TON): Down by 5.45%.
Meme coins, known for their volatility, are getting particularly hammered:
- Dogecoin (DOGE): Plummeting by 8.08%.
- Shiba Inu (SHIB): Down by 7.64%.
- Pepe (PEPE): Suffering a massive 12.84% loss.
The anticipation of a deeper crash this week is palpable. To get a clearer picture of what’s driving this market downturn and where we might be headed, let’s delve into a detailed price analysis.
Bitcoin Price Performance Breakdown
The hoped-for Saturday recovery for Bitcoin proved to be short-lived. The downward trend has not only persisted but intensified. Breaking decisively below the $56,000 threshold, Bitcoin is currently trading around $55,269, marking a nearly 5% decline over the past 24 hours. This price action is painting a distinctly bearish picture on the daily charts.
Adding to the bearish signals, the has broken below a descending trendline. The 4% drop experienced on Sunday formed a bearish engulfing candle, effectively reigniting the bearish trend and dampening any bullish sentiment.
The impact of this downturn is evident in the liquidation data. On Sunday, the broader crypto market witnessed a staggering $111 million in long liquidations. This trend is continuing into Monday, with an additional $75 million liquidated in the early trading hours. These liquidations are not just numbers; they represent traders who bet on rising prices and were caught on the wrong side of this sudden market shift.
The ongoing price action is clearly signaling a continuation of the downtrend, and these substantial long liquidations are only emboldening bearish traders, potentially creating a self-fulfilling prophecy of further price declines.
Bitcoin Hashrate: A Bearish or Bullish Indicator?
Interestingly, amidst this price crash, a critical indicator known as the Bitcoin network’s hashrate drawdown is flashing signals that might be interpreted as contrarian. The hashrate drawdown measures dips in mining activity, and according to data from Cryptoquant, this metric has plummeted to levels not seen since December 2022.
Historically, significant hashrate drawdowns have often coincided with major price movements. Notably, the December 2022 drawdown preceded a substantial bull reversal, leading some analysts to believe that the current situation could be a precursor to a similar positive price shift.
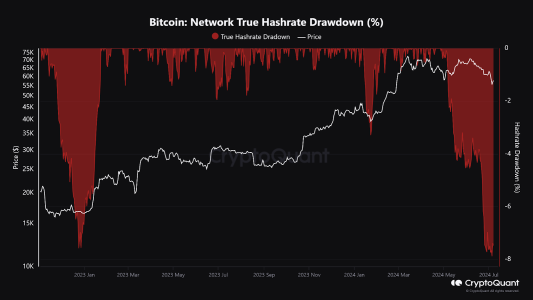
The logic behind this potential bullish signal is that a deep hashrate drawdown could indicate miner capitulation – a point where miners, often considered informed market participants, might be reducing operations due to unprofitability at lower prices. This capitulation can sometimes signal a market bottom, setting the stage for a subsequent bullish phase as selling pressure diminishes.
However, this optimistic interpretation clashes with the current bearish price action. Bitcoin’s price breaking below $56,000 suggests that immediate market sentiment is overwhelmingly negative, potentially overriding any bullish signals from the hashrate drawdown.
Looking ahead, the next significant support level for Bitcoin is around $52,000. This level is being eyed as a potential ‘bounce pad’ – a point where buyers might step in, initiating a bullish rally towards the often-discussed $100,000 target. Whether this support will hold remains to be seen, and depends heavily on overall market sentiment and external factors.
Mt. Gox Payouts: Fueling Market Uncertainty?
Another factor contributing to the current market jitters is the ongoing Mt. Gox payout saga. The collapse of the Mt. Gox crypto exchange back in 2014 was a watershed moment in crypto history. Now, after a decade of waiting, the repayment process to creditors has finally commenced, but it’s bringing with it a wave of fear – the fear of a massive supply dump.
According to the latest trustee documents, Mt. Gox creditors are slated to receive their repayments in Bitcoin (BTC) or Bitcoin Cash (BCH) within the next two weeks to three months. The exact timeframe depends on the exchange chosen by the creditor for receiving the funds. Exchanges like Bitbank and SBI VC Trade are aiming for payouts within the next two weeks, while Kraken might take up to three months to complete the distributions.
The intention behind staggering the payouts is reportedly to mitigate the risk of a sudden, massive price dump. However, the sheer volume of Bitcoin being distributed – estimated at around $2.71 billion – is undoubtedly causing anxiety and market uncertainty. The fear is that a significant portion of these creditors, many of whom have been waiting for a decade, might choose to sell their newly received Bitcoin, adding substantial selling pressure to the market.
Bitcoin’s Path This Week: More Downside Ahead?
The prevailing sentiment in the crypto market is currently dominated by FUD (Fear, Uncertainty, and Doubt). Given the current market dynamics, it appears likely that bear-side movements will continue to dictate price action this week.
With Bitcoin having decisively broken below $56,000, the $52,000 level is now the key support to watch. A break below this level could open the door for further downside. Adding to the bearish outlook, the ongoing downtrend is increasing the possibility of a ‘death cross’ – a technically bearish pattern that occurs when the 50-day Exponential Moving Average (EMA) crosses below the 200-day EMA. This is often interpreted as a signal of further long-term bearish momentum.
If Bitcoin continues its decline, altcoins are likely to experience even more significant drops and potentially larger liquidations. The coming week could be a crucial period for the crypto market, and investors should brace for potential volatility and further price corrections.
Disclaimer: The information provided is not trading advice, Bitcoinworld.co.in holds no liability for any investments made based on the information provided on this page. We strongly recommend independent research and/or consultation with a qualified professional before making any investment decisions.