
Cryptocurrency enthusiasts, buckle up! XRP, Ripple’s digital asset, has shown impressive resilience after a recent dip. Just when things looked bearish, XRP bounced back with a significant surge, outperforming even crypto giants like Bitcoin and Ethereum. Let’s dive into the latest price movements and analyze what’s next for XRP.
XRP Finds Solid Footing Around $0.32
Recently, XRP faced a notable downturn, with its price seeking support against the US Dollar. The critical level to watch was around $0.320. Bears attempted to push the price below this point not once, but twice. However, each attempt was met with strong buying pressure, indicating robust support in this zone. This level acted as a price floor, preventing further declines and setting the stage for a potential recovery.
The chart below visually represents this price action:
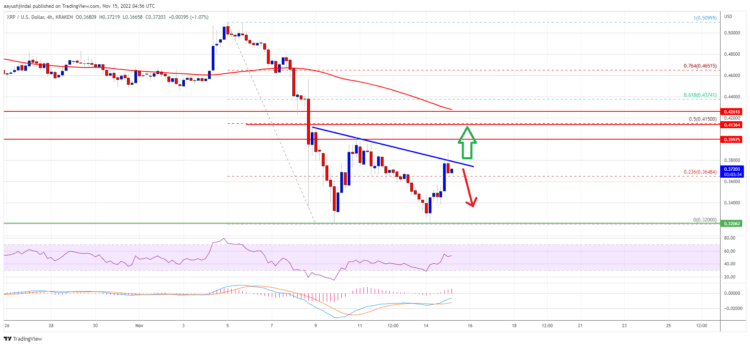
Image Source: XRPUSD on TradingView.com
The Bullish Turnaround: A 15% Price Pump
After establishing a low near $0.32, XRP’s price action took a dramatic turn. In a powerful display of bullish momentum, XRP surged upwards, gaining approximately 15% in value. This impressive rally wasn’t just a minor uptick; it was a decisive break above the $0.35 resistance barrier. This move signaled a shift in market sentiment and indicated renewed buying interest in XRP.
This upward movement also saw XRP surpass the 23.6% Fibonacci retracement level. For those unfamiliar, Fibonacci retracement levels are horizontal lines on a price chart that indicate potential areas of support or resistance. They are based on the Fibonacci sequence. In this context, the 23.6% retracement level was calculated from the recent swing high of $0.5099 down to the swing low of $0.3200. Breaking above this level is often seen as a positive sign by technical analysts.
Facing Resistance at $0.38: What’s Next for XRP?
The bullish momentum continued as XRP accelerated towards the $0.360 level. However, the journey upwards isn’t without obstacles. Currently, XRP is trading below $0.400 and also under the 100 simple moving average (SMA) on the 4-hour chart. The 100 SMA is a commonly used indicator that smooths out price fluctuations over the past 100 periods (in this case, 4-hour periods), providing a clearer picture of the trend.
A significant resistance zone is forming around $0.380. Adding to this resistance is a bearish trend line that’s also developing on the 4-hour chart for the XRP/USD pair. This trend line acts as a dynamic resistance, potentially pushing the price downwards as it approaches.
Key Resistance Levels to Watch
- $0.380 – $0.385: This zone represents immediate resistance, formed by the bearish trend line and price action. A decisive break above this area is crucial for further gains.
- $0.415: This level is the next significant hurdle. It coincides closely with the 50% Fibonacci retracement level of the recent decline (from $0.5099 to $0.3200). Overcoming this level would be a strong bullish signal.
- $0.44: Beyond $0.415, the next target for XRP bulls could be around $0.44.
Will XRP Break Through? Potential Scenarios
The immediate future of XRP’s price action hinges on its ability to overcome the $0.380 and $0.385 resistance levels. Let’s consider the possible scenarios:
- Bullish Scenario: Breakout Above $0.385
If XRP manages to break decisively above $0.385, it could trigger another rally. This breakout would negate the bearish trend line and pave the way for a move towards the $0.415 resistance. Sustained momentum could even push the price towards the $0.44 target and beyond.
- Bearish Scenario: Rejection at $0.380
Conversely, if XRP fails to break above $0.380 and encounters strong rejection at this level, we could see a pullback. Failure to overcome this resistance might indicate that the bullish momentum is weakening, potentially leading to a retest of lower support levels.
XRP Price Levels at a Glance
| Level | Significance |
|---|---|
| $0.320 | Strong Support Level |
| $0.350 | Previous Resistance (Now Support) |
| $0.380 – $0.385 | Key Resistance Zone (Bearish Trend Line) |
| $0.415 | 50% Fibonacci Retracement Level (Major Resistance) |
| $0.44 | Next Potential Target (If $0.415 is broken) |
Conclusion: XRP’s Path Forward
XRP has demonstrated a notable recovery, fueled by strong support around $0.32. The 15% price surge is encouraging for bulls, but the journey ahead is paved with resistance. The $0.380 – $0.385 zone is critical. A successful break above this level could open the door for further upside, targeting $0.415 and potentially $0.44. However, failure to overcome this resistance could lead to a price correction.
As always in the volatile crypto market, it’s crucial to stay informed and monitor price action closely. Keep an eye on these key levels and be prepared for potential shifts in momentum. Will XRP break through and continue its ascent, or will resistance prove too strong? Only time will tell, but the next few trading sessions will be crucial in determining XRP’s short-term trajectory.
Disclaimer: The information provided is not trading advice, Bitcoinworld.co.in holds no liability for any investments made based on the information provided on this page. We strongly recommend independent research and/or consultation with a qualified professional before making any investment decisions.