Cryptocurrency markets are known for their rapid fluctuations, and today, we’re taking a closer look at Ripple’s XRP. If you’re holding XRP or considering investing, you’ll want to pay attention to recent price movements. Let’s dive into the latest data and understand what’s happening with XRP.
XRP Price Downtrend: A 24-Hour Snapshot
Over the past 24 hours, the price of XRP has experienced a notable decrease, dropping by 3.15%. Currently trading at $0.47, this decline continues a trend observed over the last week. Looking back seven days, XRP has fallen by 4.0%, moving from $0.49 to its present price point. This consistent downward pressure raises questions about the factors influencing XRP’s market performance.
To visualize this price action and understand the volatility involved, take a look at the charts below:
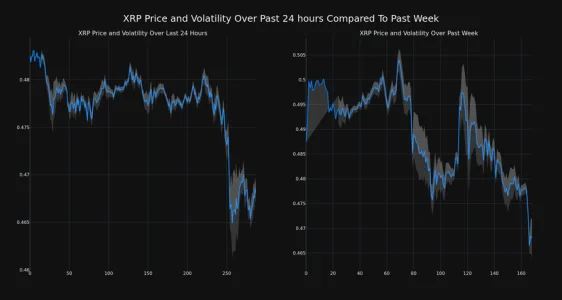
These charts provide a visual representation of XRP’s price movement and volatility. The left chart focuses on the last 24 hours, while the right chart broadens the view to the past week. The gray bands you see are Bollinger Bands, a popular tool in technical analysis used to measure volatility.
Decoding Volatility with Bollinger Bands
Bollinger Bands are crucial for understanding price fluctuations. Here’s a simple breakdown:
- What they are: They are bands plotted at a standard deviation level above and below a simple moving average of the price.
- What they show: They dynamically widen and contract based on market volatility.
- Interpreting the width: When the bands are wide, it indicates high volatility, meaning the price is experiencing significant swings. Conversely, narrow bands suggest lower volatility with less price fluctuation.
In the context of XRP’s charts, the width of the gray bands visually represents the degree of volatility in both the daily and weekly price movements. A wider gray area signals higher volatility during that period.
Trading Volume and Circulating Supply: Key Indicators to Watch
Beyond price and volatility, other metrics offer valuable insights into XRP’s market dynamics. Let’s examine trading volume and circulating supply:
- Trading Volume Decline: A significant decrease of 42.0% in XRP’s trading volume over the past week is observed. Lower trading volume can sometimes amplify price movements, making the asset more susceptible to volatility. It can also indicate decreased investor interest or market participation.
- Circulating Supply Adjustment: The circulating supply of XRP has slightly decreased by 0.24% in the last week, now standing at over 55.57 billion coins.
To put this in perspective, consider the following chart:
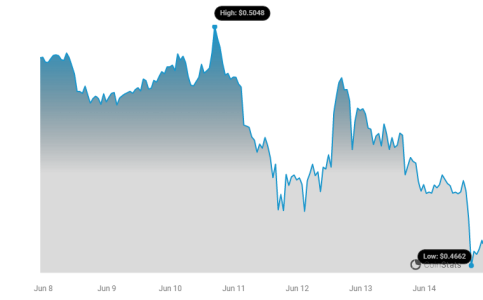
This chart visually represents XRP’s price action over a period, sourced from Coinstats, providing a clear picture of its market behavior.
Circulating Supply and Market Cap: Understanding XRP’s Position
Currently, the circulating supply of XRP is estimated to be 55.57 billion coins. When compared to its maximum supply of 100 billion, this means approximately 55.57% of the total possible XRP coins are currently in circulation.
In terms of market capitalization, XRP holds the #8 position in the cryptocurrency rankings, with a market cap of $25.99 billion. Market cap ranking is a useful metric to understand the relative size and dominance of a cryptocurrency in the overall market. While a top 10 ranking signifies a strong market presence, price fluctuations can influence these rankings, making it essential to stay informed about market movements.
What Does This Mean for XRP Investors?
The recent price decrease in XRP, coupled with reduced trading volume, suggests a period of market caution. For investors, understanding these trends is crucial for making informed decisions. Here are a few key takeaways:
- Volatility is Present: The Bollinger Bands highlight ongoing volatility in XRP. Be prepared for potential price swings.
- Trading Volume Matters: Lower trading volume can exacerbate price movements. Keep an eye on volume trends for potential shifts in market sentiment.
- Market Sentiment: Price declines often reflect broader market sentiment or specific news impacting the asset. Staying informed about the factors influencing the crypto market is crucial.
Disclaimer: It’s important to remember that the information provided here is for informational purposes only and should not be considered trading advice. Cryptocurrency investments are inherently risky, and past performance is not indicative of future results.
Before making any investment decisions regarding XRP or any other cryptocurrency, we strongly recommend conducting thorough independent research and/or consulting with a qualified financial professional. The cryptocurrency market is dynamic and requires careful consideration and due diligence.
In Conclusion: Staying Informed in a Volatile Market
XRP’s recent price dip and decreased trading volume are important signals for anyone tracking this cryptocurrency. By understanding the interplay of price movements, volatility indicators like Bollinger Bands, trading volume, and circulating supply, investors can gain a more nuanced perspective on market dynamics. In the ever-evolving world of crypto, staying informed and conducting thorough research remains the best strategy for navigating market fluctuations and making sound investment choices.
Keep following Bitcoinworld.co.in for the latest updates and in-depth analysis of the cryptocurrency market.
Disclaimer: The information provided is not trading advice, Bitcoinworld.co.in holds no liability for any investments made based on the information provided on this page. We strongly recommend independent research and/or consultation with a qualified professional before making any investment decisions.