Buckle up, crypto enthusiasts! The XRP market has been experiencing some turbulence. Over the past 24 hours, the price of XRP has taken a noticeable dip, falling by 5.83% to $0.61. This downward movement extends a week-long trend, with XRP sliding down 5.0% from $0.69. Let’s dive into the details and understand what’s shaping XRP’s current market behavior.
XRP Price Performance: A Snapshot of Recent Movements
To get a clearer picture of XRP’s price action, let’s look at the recent data. The price chart below illustrates the 24-hour and 7-day price movements.
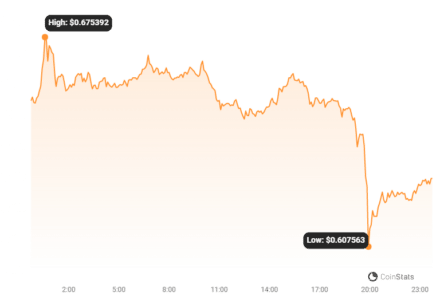
As you can see, the chart visually confirms the recent price decrease. But what about volatility? Let’s explore that next.
Decoding Volatility: Bollinger Bands and XRP’s Price Swings
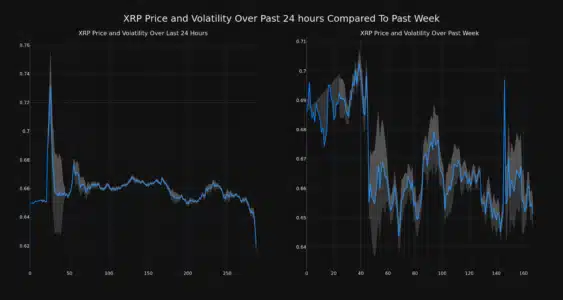
Volatility is a key indicator of how much the price of an asset fluctuates over time. To understand XRP’s volatility, we can use Bollinger Bands. These bands, represented by the gray areas in the charts below, help us visualize the range of price movement. Wider bands indicate higher volatility, meaning more significant price swings.
Take a look at the charts comparing XRP’s volatility over the last 24 hours (left) and the past week (right):
Read Also: Fake ETF News On BlackRock Pushes Ripple XRP Up By 12%
The charts illustrate the volatility in XRP’s price. By observing the width of the Bollinger Bands, you can gauge the intensity of price fluctuations over different timeframes.
Trading Volume vs. Circulating Supply: Unpacking the Numbers
Now, let’s shift our focus to trading volume and circulating supply. These metrics offer insights into the coin’s market activity and availability.
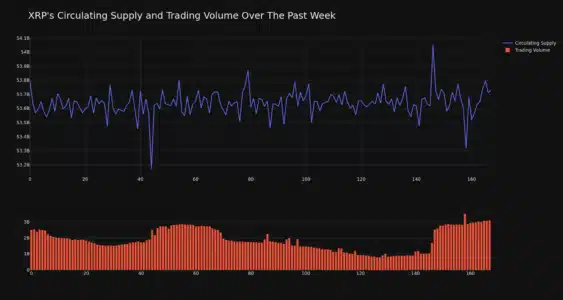
Interestingly, while the price has been declining, the trading volume for XRP has actually increased by 24.0% over the past week. This means that despite the price drop, there’s been a surge in buying and selling activity. This can sometimes indicate traders trying to capitalize on price dips or reacting to market news.
On the other hand, the circulating supply of XRP has slightly decreased by 0.12% in the same period. This brings the current circulating supply to 53.65 billion XRP, which is approximately 53.65% of its total maximum supply of 100 billion XRP.
Here’s a visual representation of the circulating supply and trading volume trends:
XRP Market Cap and Ranking: Where Does it Stand?
Market capitalization, or market cap, is a crucial metric that reflects the total value of a cryptocurrency. It’s calculated by multiplying the current price of a coin by its circulating supply.
According to our latest data, XRP currently holds the #5 rank in the cryptocurrency market cap rankings, with a market cap of $33.60 billion. This ranking indicates XRP’s significant position within the broader crypto ecosystem, despite the recent price pullback.
Key Takeaways and Considerations for XRP Investors
Let’s summarize the key points from our XRP market analysis:
- Price Decline: XRP has experienced a price decrease of 5.83% in the last 24 hours and a 5.0% decrease over the past week.
- Increased Volatility: Bollinger Bands indicate ongoing price volatility in both daily and weekly timeframes.
- Surging Trading Volume: Despite the price drop, trading volume has increased by 24.0% over the last week, suggesting active market participation.
- Slight Supply Decrease: The circulating supply of XRP has slightly decreased by 0.12%.
- Top Market Cap Ranking: XRP remains a top cryptocurrency, holding the #5 market cap rank at $33.60 billion.
What does this mean for XRP investors?
The current market data presents a mixed picture. The price decline and volatility might be concerning for some, while the increased trading volume could indicate buying opportunities for others. It’s crucial to remember that the cryptocurrency market is inherently volatile, and price fluctuations are common.
For investors, it’s essential to:
- Stay Informed: Keep track of market trends, news, and developments related to XRP and the broader crypto market.
- Do Your Own Research (DYOR): Don’t rely solely on price charts. Understand the fundamentals of XRP, Ripple, and the factors that can influence its price.
- Manage Risk: Invest responsibly and only invest what you can afford to lose. Consider diversifying your portfolio to mitigate risk.
Disclaimer: The information provided in this article is for informational purposes only and should not be considered financial or trading advice. Cryptocurrency investments are subject to market risks. Always conduct thorough independent research and consult with a qualified financial advisor before making any investment decisions.
Disclaimer: The information provided is not trading advice. Bitcoinworld.co.in holds no liability for any investments made based on the information provided on this page. We strongly recommend independent research and/or consultation with a qualified professional before making any investment decisions.
Disclaimer: The information provided is not trading advice, Bitcoinworld.co.in holds no liability for any investments made based on the information provided on this page. We strongly recommend independent research and/or consultation with a qualified professional before making any investment decisions.