Cryptocurrency markets are known for their thrilling ups and downs, and XRP is no stranger to this volatility. Recently, XRP holders have witnessed some price fluctuations. Let’s dive into the latest data to understand what’s been happening with XRP’s price, volatility, and market activity.
XRP Price Under Pressure: What’s Behind the Recent Dip?
Over the last 24 hours, XRP’s price experienced a notable decrease, dropping by 7.47% to around $0.60. Zooming out slightly, the past week also reflects a downward trend, with XRP declining by 2.0% from $0.628. But what do these numbers really mean for investors and the broader XRP ecosystem?
Let’s break down the key factors:
- Recent Price Drop: A 7.47% decrease in 24 hours is a significant move in the crypto world. While not uncommon, it signals increased selling pressure or broader market sentiment affecting XRP.
- Weekly Trend: The continuation of a downward trend over the past week suggests this isn’t just a one-day blip but a sustained period of price correction.
- Price Level: Falling from $0.628 to $0.60 is a key psychological level. Traders often watch these levels for potential support or resistance.
To visualize this price movement and understand the volatility, take a look at the charts below:
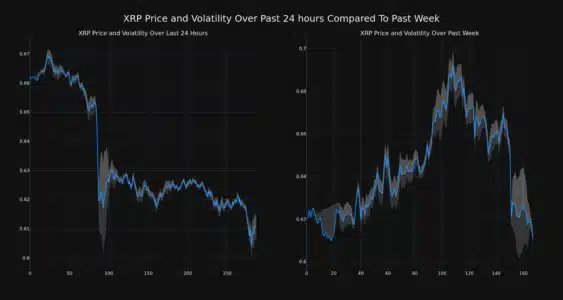
These charts use Bollinger Bands (the gray bands) to illustrate XRP’s price volatility over the last 24 hours (left) and the past week (right). Bollinger Bands are a handy tool for gauging market volatility. Here’s how to interpret them:
- Wider Bands = Higher Volatility: When the gray bands widen, it indicates increased price fluctuations. A larger gray area suggests more significant volatility during that period.
- Narrower Bands = Lower Volatility: Conversely, narrower bands would mean less price movement and lower volatility.
In the provided charts, you can visually assess the level of volatility XRP has experienced recently. Are the bands wide or narrow? This gives you a quick snapshot of how much the price has been swinging.
See Also: Dogecoin Decreased More Than 8% Within 24 hours
Trading Volume and Circulating Supply: What’s the Connection?
Beyond price and volatility, understanding trading volume and circulating supply can offer deeper insights into XRP’s market dynamics. Let’s examine these aspects:
- Trading Volume Surge: Interestingly, despite the price dip, XRP’s trading volume has increased by 12.0% over the past week. This could indicate increased interest in XRP, even amidst the price correction. Higher trading volume can sometimes precede significant price movements, either upwards or downwards, as it shows more activity in the market.
- Circulating Supply Increase: The circulating supply of XRP has also slightly increased by 0.22% in the past week. Circulating supply refers to the number of XRP tokens currently available to the public for trading.
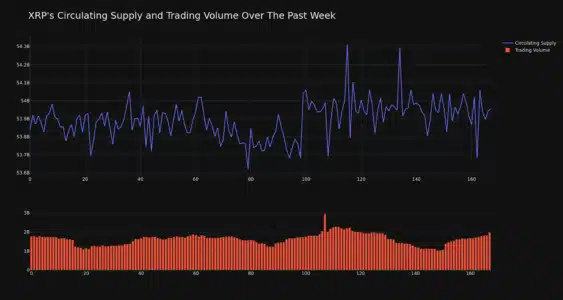
Currently, the circulating supply of XRP stands at 53.96 billion tokens. When compared to its maximum supply of 100 billion, this means that approximately 53.96% of all XRP tokens are currently in circulation.
Why is circulating supply important? It’s a key factor in determining market capitalization. Market cap, calculated by multiplying the circulating supply by the current price, gives us a sense of the total value of a cryptocurrency. As per our data, XRP currently holds the #5 position in market cap rankings, with a market capitalization of $32.94 billion.
XRP Price Recovery? A Glimmer of Hope
While the initial report highlighted a price decrease, there’s a silver lining. Recent data suggests that XRP has shown resilience and has started to recover from its recent fall. It has managed to regain its position around the $0.62 mark. This recovery could be a sign of底部 finding support or renewed buying interest.
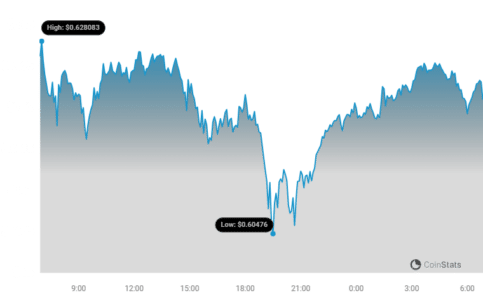
To stay updated on XRP’s price movements and other cryptocurrency trends, reliable resources like CoinStats (as credited in the chart above) are invaluable. Continuously monitoring price charts and market news is crucial for making informed decisions in the dynamic crypto market.
Key Takeaways and Looking Ahead
In summary, XRP has experienced recent price volatility, including a dip below $0.61. However, increased trading volume and a potential price recovery indicate ongoing market interest and dynamic price action. Here are some key points to remember:
- Volatility is Normal: Cryptocurrency markets are inherently volatile. Price fluctuations, both upward and downward, are part of the landscape.
- Monitor Key Metrics: Keep an eye on price movements, volatility (using tools like Bollinger Bands), trading volume, and circulating supply to get a comprehensive view of XRP’s market health.
- Stay Informed: Utilize reputable sources like CoinStats and other crypto news platforms to stay updated on the latest market developments.
- Market Cap Ranking: XRP’s position as a top cryptocurrency by market cap reflects its significant presence in the crypto space.
The cryptocurrency market is constantly evolving. Understanding these fluctuations and staying informed are crucial for anyone involved in or interested in XRP and the broader crypto world. Keep watching the charts, stay informed, and navigate the crypto journey with knowledge and caution!
Disclaimer: The information provided is not trading advice, Bitcoinworld.co.in holds no liability for any investments made based on the information provided on this page. We strongly recommend independent research and/or consultation with a qualified professional before making any investment decisions.