
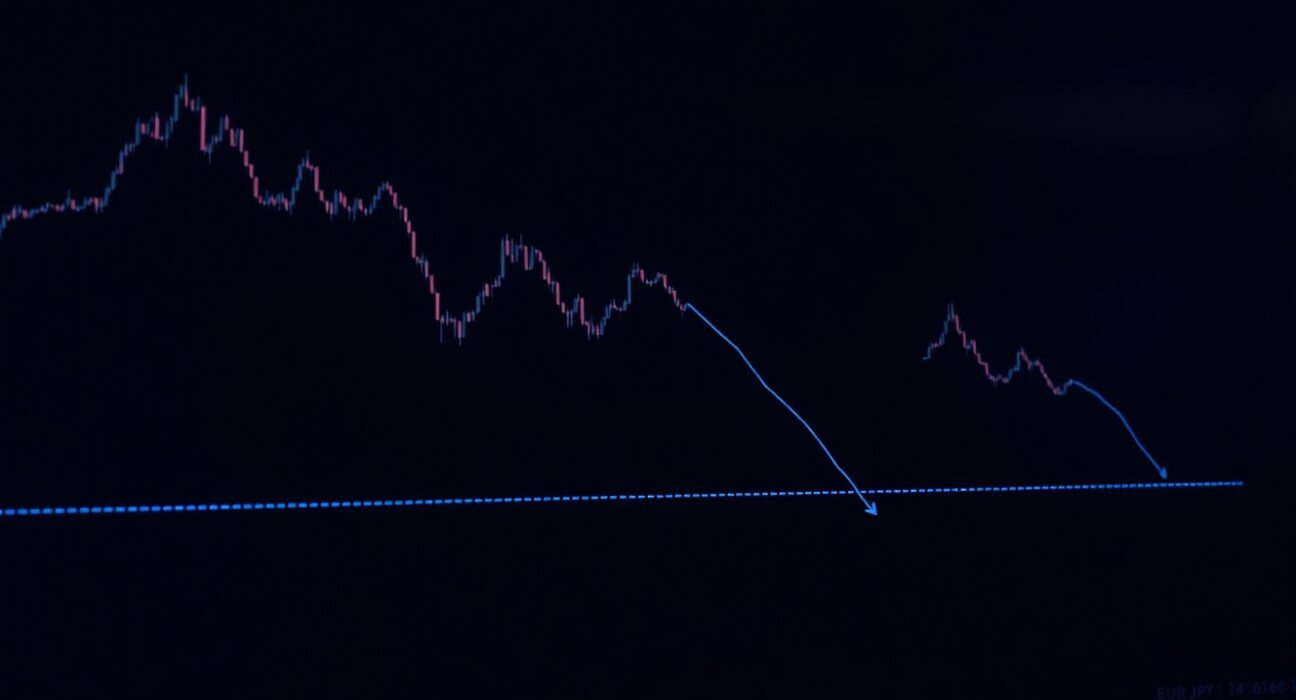
The EUR/JPY Price Forecast has turned decisively bearish as the currency pair moves below the critical 186.50 support level. This breakdown occurs at a key nine-day confluence zone, where moving averages and trendlines converge. Traders now watch for further downside momentum. On March 27, 2025, in London, the pair tested 186.30, confirming the bearish breakout.
EUR/JPY Below 186.50: Technical Breakdown
The EUR/JPY below 186.50 marks a significant technical event. The nine-day exponential moving average (EMA) aligns with a horizontal support line, creating a powerful confluence. This zone previously held for two weeks. Now, sellers have gained control. The daily candlestick closed below this level, confirming the break.
Key technical indicators support this bearish view. The Relative Strength Index (RSI) dropped below 40, entering bearish territory. The Moving Average Convergence Divergence (MACD) line crossed below its signal line. This crossover adds weight to the downside bias. Volume increased during the breakdown, suggesting strong selling pressure.
Nine-Day Confluence Zone Explained
The nine-day confluence refers to the intersection of multiple technical tools. Here, the 9-day EMA meets a horizontal resistance-turned-support level at 186.50. This area also aligns with a Fibonacci retracement level at 38.2%. Such confluences attract attention from algorithmic and manual traders alike. A break below this zone often triggers stop-loss orders, accelerating the move.
Historical data shows similar confluences often precede moves of 100–150 pips. The current breakdown targets the next support at 185.00. A daily close below 186.00 would confirm the bearish scenario.
Market Context and Drivers
The EUR/JPY Price Forecast is influenced by macroeconomic factors. The European Central Bank (ECB) recently signaled a potential rate cut in June 2025. This dovish stance weakens the euro. Meanwhile, the Bank of Japan (BoJ) maintains a hawkish tone, supporting the yen. Divergent monetary policies drive the pair lower.
Key economic data releases this week add pressure. Eurozone inflation fell to 2.1%, below the 2.3% forecast. This increases the likelihood of ECB easing. Japan’s core CPI rose to 2.8%, above expectations. This strengthens the case for BoJ tightening. The interest rate differential narrows, favoring the yen.
Impact on Forex Traders
Forex traders must adjust strategies. The EUR/JPY below 186.50 invalidates previous bullish setups. Short positions now gain favor. Stop-loss orders above 187.00 protect against false breakouts. Take-profit targets near 185.00 offer a risk-reward ratio of 1:2. Momentum traders watch for a retest of 186.50 as new resistance.
- Support levels: 185.00, 184.20, 183.50
- Resistance levels: 186.50, 187.20, 188.00
- Key event: ECB and BoJ policy meetings in April
Expert Analysis and Forward Outlook
Market analysts at major banks share their views. Barclays notes the nine-day confluence breakdown as a strong bearish signal. They predict a move to 184.50 within two weeks. Goldman Sachs highlights the importance of the 185.00 level. A break below this could open the door to 182.00. However, they caution against oversold conditions.
The EUR/JPY Price Forecast depends on upcoming data. The Eurozone GDP report on April 3 could trigger volatility. A weak reading would pressure the euro further. Japan’s Tankan survey on April 1 may boost the yen. Traders should monitor these releases closely.
Timeline of Key Levels
| Level | Significance | Target Date |
|---|---|---|
| 186.50 | Broken support, now resistance | March 27 |
| 185.00 | Next major support | April 1–3 |
| 184.20 | Fibonacci 61.8% retracement | April 7–10 |
Conclusion
The EUR/JPY Price Forecast points to further downside after breaking below the 186.50 nine-day confluence. Technical indicators, divergent central bank policies, and weak Eurozone data all support a bearish outlook. Traders should focus on the 185.00 support level as the next key target. Monitoring upcoming economic releases will be crucial for confirming the trend. This breakdown marks a pivotal moment for the pair.
FAQs
Q1: What does EUR/JPY below 186.50 mean for traders?
A1: It signals a bearish trend shift. Traders should consider short positions with targets near 185.00. The level now acts as resistance.
Q2: Why is the nine-day confluence important?
A2: The nine-day confluence combines the 9-day EMA, horizontal support, and Fibonacci level. This increases the breakout’s reliability and often triggers larger moves.
Q3: What factors drove EUR/JPY below 186.50?
A3: Dovish ECB signals, hawkish BoJ stance, weak Eurozone inflation, and strong Japan CPI data all contributed. Technical selling accelerated the breakdown.
Q4: What are the next key support levels?
A4: The next support is 185.00, followed by 184.20 and 183.50. A break below 185.00 could lead to a test of 182.00.
Q5: How should I set stop-loss orders?
A5: Place stop-loss orders above 187.00 for short positions. This accounts for potential false breakouts or retests of the broken support.
Disclaimer: The information provided is not trading advice, Bitcoinworld.co.in holds no liability for any investments made based on the information provided on this page. We strongly recommend independent research and/or consultation with a qualified professional before making any investment decisions.