
2026-07-30
The USD/JPY pair continues to attract bullish momentum as the 20-day exponential moving average (EMA) trends upward, reinforcing a positive technical outlook for.

The USD/JPY pair continues to attract bullish momentum as the 20-day exponential moving average (EMA) trends upward, reinforcing a positive technical outlook for.

The USD/CAD currency pair has rebounded above the 1.4050 level, maintaining a constructive technical outlook as it trades above the key 100-day Simple.

As of 12:00 a.m. UTC on July 30, the spot cumulative volume delta (CVD) chart for the BTC/USDT trading pair on Binance reveals.

GBP/JPY bulls have reclaimed the 218.00 level as the Relative Strength Index (RSI) shows improvement, signaling potential for further upside in the near.

The EUR/JPY currency pair is approaching a critical technical juncture, with analysts eyeing the completion of a rising wedge pattern that targets the.

The price of gold (XAU/USD) bounced on Thursday, recovering from recent losses after a series of disappointing U.S. economic data releases reignited expectations.
West Texas Intermediate (WTI) crude oil futures have decisively broken below the psychologically significant $80 per barrel level, shifting the technical focus to.

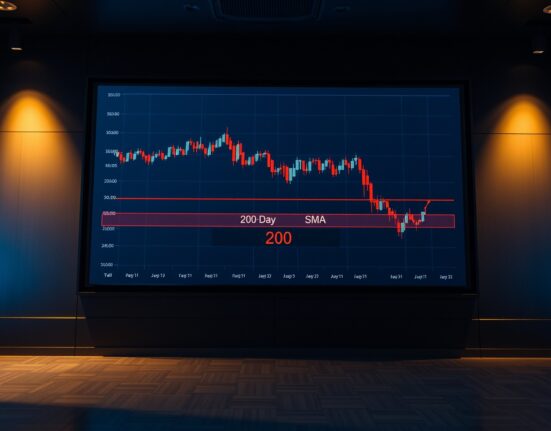
Uniswap’s native token, UNI, is currently testing the 200-day exponential moving average (EMA) as a key resistance level, a development occurring alongside a.
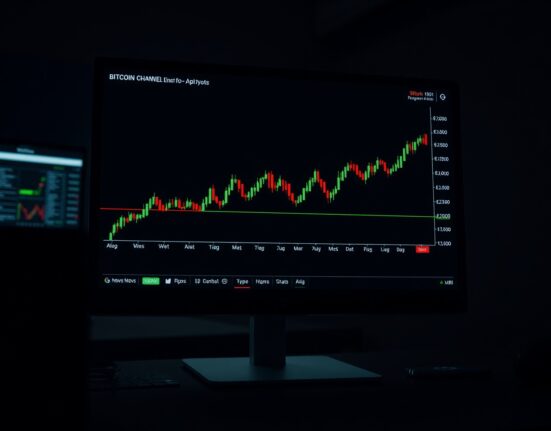
Bitcoin’s price action continues to trade within a well-defined long-term trend channel, failing to break out decisively despite recent market volatility. As of.

The EUR/USD currency pair continues to trade under significant selling pressure, with year-to-date (YTD) lows at 1.1324 increasingly within reach as of the.