

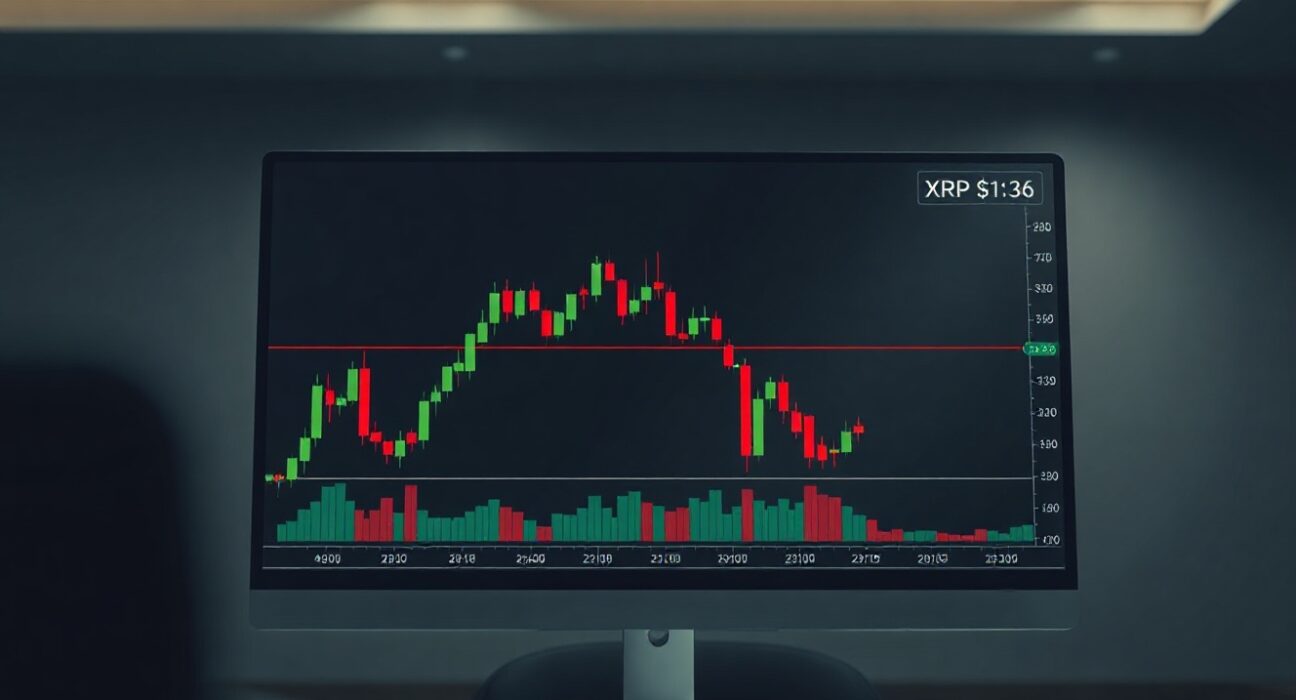
XRP has settled into a defined trading range after a failed attempt to break through the $1.36 resistance level, a development that technical analysts suggest could precede a period of heightened volatility. The digital asset, which had recently shown signs of upward momentum with a high-volume bullish candle, was unable to sustain the breakout, leading to a weakening of short-term bullish sentiment.
Price Compression and Technical Setup
The price action is now compressing within a triangular convergence pattern that has been forming since early 2025. This pattern, characterized by tightening price swings and decreasing volume, typically signals that a significant directional move is approaching. The longer the consolidation, the more powerful the eventual breakout or breakdown is expected to be, according to technical analysis principles.
The failure at $1.36 is notable because it occurred on elevated trading volume, which initially suggested strong buying interest. However, sellers defended the level, pushing prices back into the range. This rejection has placed the focus on the $1.30 support level, which has held firm despite a broader downturn in cryptocurrency market sentiment.
On-Chain Data Points to Accumulation
On-chain metrics provide a contrasting narrative to the price action. Data shows a continuous outflow of XRP from exchanges, a pattern historically associated with accumulation by large-scale holders, often referred to as ‘whales.’ When tokens are moved off exchanges, it reduces the available supply for trading and is generally interpreted as a signal that holders are not preparing to sell.
This accumulation trend is seen as a positive underlying factor, suggesting that sophisticated investors are positioning for a longer-term move higher, even as short-term price action remains uncertain. The resilience of the $1.30 support level, despite worsening overall market conditions, further reinforces this interpretation.
Key Levels to Watch
The immediate outlook for XRP hinges on two critical price points. A breakdown below the $1.30 support level could trigger a decline into the mid-$1.20 range, where the next significant support zone lies. Conversely, a successful move above the $1.36 resistance would invalidate the current bearish setup and could signal a full trend reversal, potentially targeting higher resistance levels from 2024.
Traders and investors should be prepared for sharp price swings as the convergence pattern resolves. The combination of technical compression, on-chain accumulation, and uncertain macro sentiment creates a setup where volatility is almost certain.
Why This Matters
XRP remains one of the most actively traded cryptocurrencies, and its price movements often influence broader market sentiment. The current consolidation phase is significant because it follows a period of relative strength compared to other major digital assets. Whether XRP breaks higher or lower will provide important clues about the direction of the broader cryptocurrency market in the coming weeks.
For holders and traders, the key takeaway is the importance of the $1.30 and $1.36 levels. Until one of these boundaries is broken decisively, the market is likely to remain in a state of uncertainty, with the potential for rapid moves in either direction.
Conclusion
XRP is at a critical juncture, caught between technical compression and conflicting on-chain signals. The failed breakout at $1.36 has tempered short-term optimism, but persistent accumulation and steady support at $1.30 suggest that larger market participants are not yet abandoning the asset. The resolution of this trading range will likely define XRP’s trajectory for the next several weeks, making it a key cryptocurrency to watch.
FAQs
Q1: What is a triangular convergence pattern in trading?
A triangular convergence pattern occurs when an asset’s price swings become progressively narrower, forming a triangle on the chart. It typically indicates that a period of consolidation is ending and a significant breakout or breakdown is imminent.
Q2: Why is exchange outflow considered a bullish signal?
When cryptocurrency is moved from exchanges to private wallets, it reduces the available supply for immediate sale. This is often interpreted as a sign that holders are accumulating and intend to hold for the long term, which can support price appreciation.
Q3: What happens if XRP breaks below $1.30?
A break below $1.30 would likely trigger further selling pressure, with the next major support zone expected in the mid-$1.20 range. It would also invalidate the current accumulation narrative and suggest that bearish momentum is gaining strength.
Disclaimer: The information provided is not trading advice, Bitcoinworld.co.in holds no liability for any investments made based on the information provided on this page. We strongly recommend independent research and/or consultation with a qualified professional before making any investment decisions.
