
2026-07-14
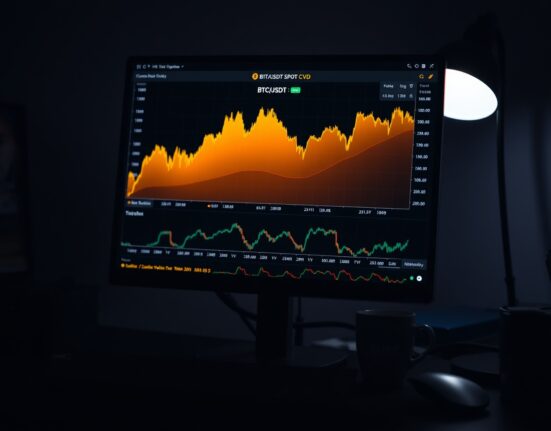
Bitcoin traders monitoring the BTC/USDT spot pair on July 14 observed notable activity in the Cumulative Volume Delta (CVD) and Volume Heatmap indicators..

Bitcoin traders monitoring the BTC/USDT spot pair on July 14 observed notable activity in the Cumulative Volume Delta (CVD) and Volume Heatmap indicators..

The Spot Cumulative Volume Delta (CVD) chart for the BTC/USDT trading pair, captured on July 10 at 10 a.m. UTC, provides traders with.

On July 9 at 12:00 a.m. UTC, the Spot Cumulative Volume Delta (CVD) chart for the BTC/USDT trading pair provides a detailed snapshot.

On July 8 at 2 p.m. UTC, the BTC/USDT spot pair presented a distinctive order book structure, as illustrated by the Cumulative Volume.
At 10:00 a.m. UTC, the BTC/USDT spot Cumulative Volume Delta (CVD) chart offers traders a detailed view of order book dynamics, combining a.

For traders monitoring Bitcoin’s spot market, the Cumulative Volume Delta (CVD) chart for the BTC/USDT pair offers a granular look at order flow.

On July 3, 2026, at 5 p.m. UTC, the BTC/USDT spot pair’s Cumulative Volume Delta (CVD) chart offers a detailed look into the.

On July 3, 2025, the Spot Cumulative Volume Delta (CVD) chart for the BTC/USDT trading pair on Binance provides traders with a detailed.

On June 30, the BTC/USDT spot pair exhibited notable order book dynamics, as captured by the Cumulative Volume Delta (CVD) and Volume Heatmap.

On June 27, the spot Cumulative Volume Delta (CVD) chart for the BTC/USDT trading pair offers traders a detailed look into order book.