

2026-07-27
On July 27, the spot Cumulative Volume Delta (CVD) chart for the BTC/USDT trading pair provided traders with a detailed snapshot of order.

On July 27, the spot Cumulative Volume Delta (CVD) chart for the BTC/USDT trading pair provided traders with a detailed snapshot of order.
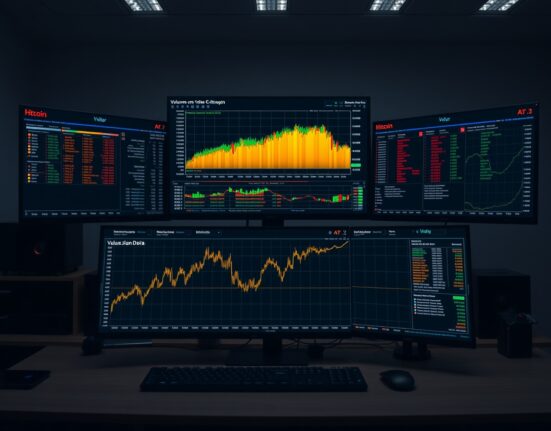
For traders monitoring Bitcoin’s price action, the Spot Cumulative Volume Delta (CVD) chart for the BTC/USDT trading pair on Binance offers a granular.

Bitcoin traders monitoring the BTC/USDT spot pair on July 14 observed notable activity in the Cumulative Volume Delta (CVD) and Volume Heatmap indicators..

The Spot Cumulative Volume Delta (CVD) chart for the BTC/USDT trading pair, captured on July 10 at 10 a.m. UTC, provides traders with.

On July 9 at 12:00 a.m. UTC, the Spot Cumulative Volume Delta (CVD) chart for the BTC/USDT trading pair provides a detailed snapshot.

On July 8 at 2 p.m. UTC, the BTC/USDT spot pair presented a distinctive order book structure, as illustrated by the Cumulative Volume.
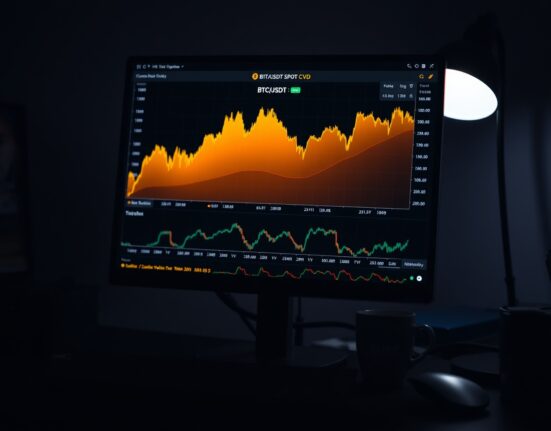
At 10:00 a.m. UTC, the BTC/USDT spot Cumulative Volume Delta (CVD) chart offers traders a detailed view of order book dynamics, combining a.

For traders monitoring Bitcoin’s spot market, the Cumulative Volume Delta (CVD) chart for the BTC/USDT pair offers a granular look at order flow.

On July 3, 2026, at 5 p.m. UTC, the BTC/USDT spot pair’s Cumulative Volume Delta (CVD) chart offers a detailed look into the.

On July 3, 2025, the Spot Cumulative Volume Delta (CVD) chart for the BTC/USDT trading pair on Binance provides traders with a detailed.