

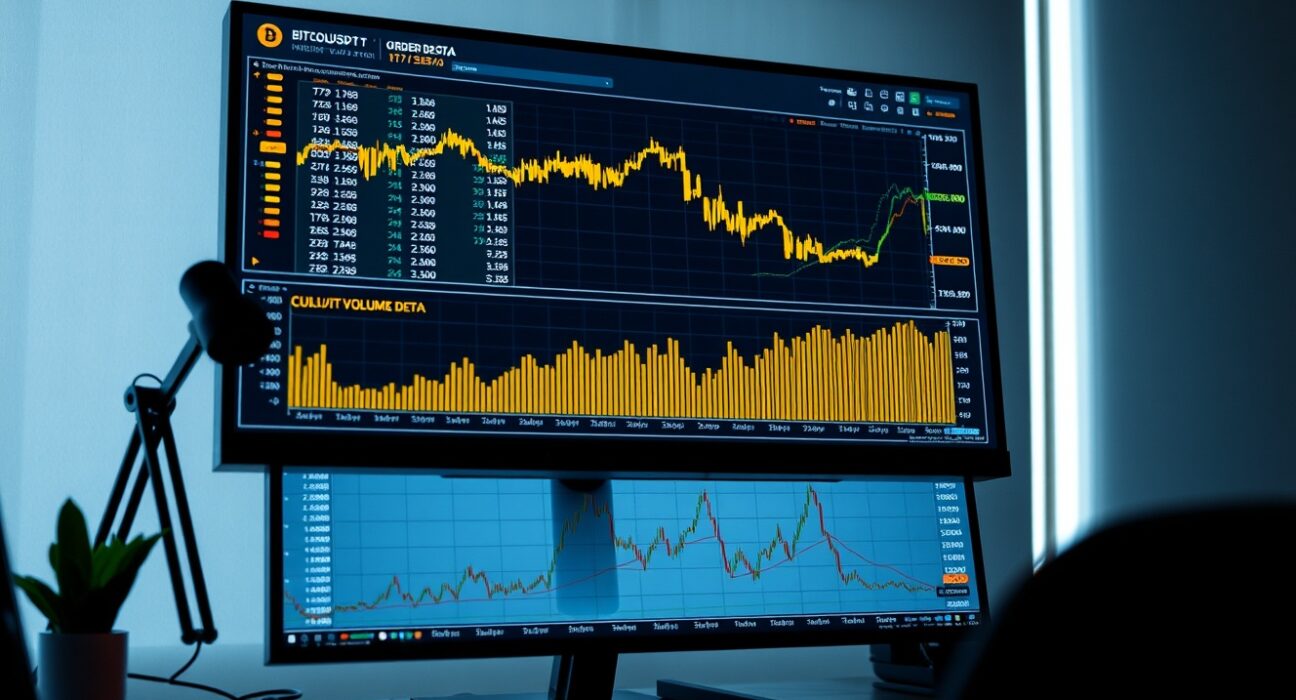
On July 9 at 12:00 a.m. UTC, the Spot Cumulative Volume Delta (CVD) chart for the BTC/USDT trading pair provides a detailed snapshot of order book activity. This tool is widely used by traders to gauge buying and selling pressure at specific price levels, offering insights that go beyond simple price movements.
Understanding the Volume Heatmap
The top section of the chart features a Volume Heatmap, which visualizes the concentration of trades at various price points. When the price remains within a certain range for an extended period or moves significantly, the background color on the heatmap becomes brighter. These highlighted areas often indicate zones where significant trading activity has occurred, and they can act as potential support or resistance levels in future price action. For traders monitoring the BTC/USDT pair, identifying these levels is crucial for setting entry and exit points.
Cumulative Volume Delta (CVD) Insights
The lower section of the chart displays the Cumulative Volume Delta (CVD), which tracks the net difference between buying and selling volume. This indicator is categorized by trade size, providing a granular view of market participation. The yellow line represents orders ranging from $100 to $1,000, typically associated with retail traders. In contrast, the brown line tracks large orders between $1 million and $10 million, which are often placed by institutional investors or whales. As buy orders increase, the corresponding colored line rises, offering a real-time gauge of market sentiment across different participant groups.
Why This Matters for Traders
The combination of the Volume Heatmap and CVD provides a multi-dimensional view of market dynamics. By analyzing where volume clusters occur and how large versus small traders are behaving, traders can identify potential breakout points or reversals. For instance, a significant rise in the brown CVD line near a heatmap-brightened resistance level could signal strong institutional buying pressure, suggesting a potential upward breakout. Conversely, a decline in the yellow line alongside a price drop might indicate weak retail support, reinforcing bearish sentiment.
Conclusion
The Spot CVD chart for BTC/USDT on July 9 at 12:00 a.m. UTC offers valuable data for traders seeking to understand order flow and market structure. By interpreting the Volume Heatmap and CVD together, market participants can make more informed decisions based on actual trading activity rather than price alone. As always, traders should use this tool in conjunction with other indicators and risk management strategies.
FAQs
Q1: What is the Spot CVD chart used for?
The Spot CVD chart helps traders analyze buying and selling pressure by tracking the cumulative volume delta and volume concentration at specific price levels for a given trading pair.
Q2: How does the Volume Heatmap indicate support and resistance?
Bright areas on the heatmap show where significant trading activity has occurred. These levels often act as support (when price falls to them) or resistance (when price rises to them) because of the high concentration of orders.
Q3: What do the different colored lines in the CVD represent?
The yellow line tracks orders between $100 and $1,000, typically retail trades, while the brown line tracks large orders between $1 million and $10 million, often from institutional traders. The lines rise as buy orders increase.
Frequently Asked Questions
What is the Spot Cumulative Volume Delta (CVD) chart used for?
It is used to gauge buying and selling pressure at specific price levels, offering insights beyond simple price movements for the BTC/USDT trading pair.
What does the Volume Heatmap in the chart show?
It visualizes the concentration of trades at various price points, with brighter areas indicating zones of significant trading activity that can act as future support or resistance.
What do the yellow and brown lines in the CVD section represent?
The yellow line tracks retail trader orders ($100-$1,000), while the brown line tracks large institutional or whale orders ($1 million-$10 million).
How can traders use the combination of the Volume Heatmap and CVD?
By analyzing where volume clusters occur and how large versus small traders behave, traders can identify potential breakout points or reversals.
What does a significant rise in the brown CVD line near a heatmap-brightened resistance level indicate?
It could signal strong institutional buying pressure, suggesting a potential breakout above that resistance level.
Disclaimer: The information provided is not trading advice, Bitcoinworld.co.in holds no liability for any investments made based on the information provided on this page. We strongly recommend independent research and/or consultation with a qualified professional before making any investment decisions.
