
2026-08-01
On July 31 at 9:00 a.m. UTC, traders monitoring the BTC/USDT spot market will have access to a detailed Spot CVD chart, which.
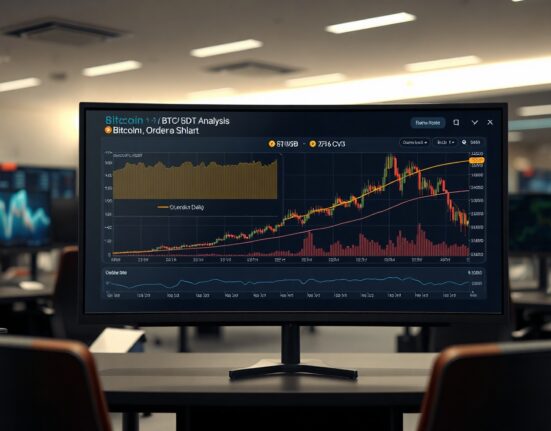
On July 31 at 9:00 a.m. UTC, traders monitoring the BTC/USDT spot market will have access to a detailed Spot CVD chart, which.

The Spot Cumulative Volume Delta (CVD) chart for the BTC/USDT trading pair, as of 12:00 a.m. UTC on July 28, provides traders with.

On July 28 at 2:00 a.m. UTC, traders monitoring the BTC/USDT spot trading pair will have access to a specialized order-book analysis chart.

On July 27, the spot Cumulative Volume Delta (CVD) chart for the BTC/USDT trading pair provided traders with a detailed snapshot of order.
For traders monitoring Bitcoin’s price action, the Spot Cumulative Volume Delta (CVD) chart for the BTC/USDT trading pair on Binance offers a granular.

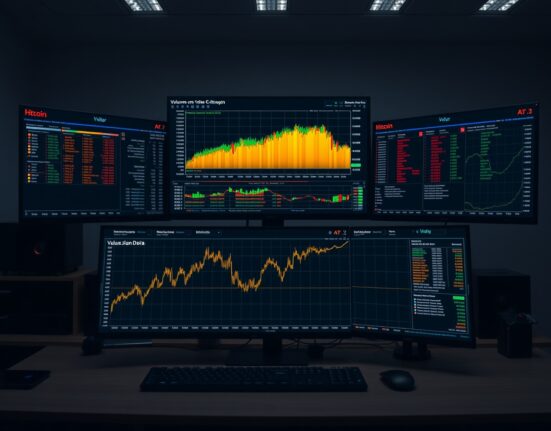
Bitcoin traders monitoring the BTC/USDT spot pair on July 14 observed notable activity in the Cumulative Volume Delta (CVD) and Volume Heatmap indicators..

For traders monitoring Bitcoin price action, the Spot Cumulative Volume Delta (CVD) chart offers a granular view of order book dynamics. The latest.

The Spot Cumulative Volume Delta (CVD) chart for the BTC/USDT trading pair, captured on July 10 at 10 a.m. UTC, provides traders with.

On July 9, 2025, the BTC/USDT spot market exhibited notable order book dynamics, as revealed by the Cumulative Volume Delta (CVD) and Volume.

On July 9 at 12:00 a.m. UTC, the Spot Cumulative Volume Delta (CVD) chart for the BTC/USDT trading pair provides a detailed snapshot.