

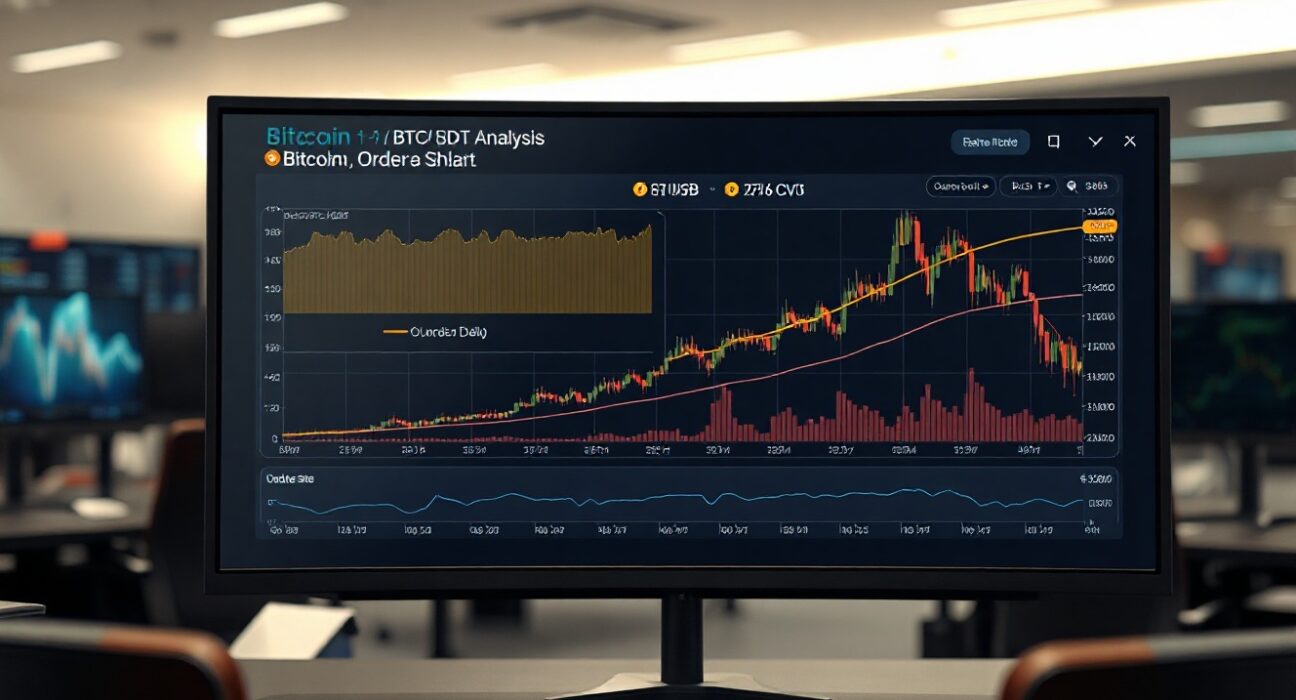
On July 31 at 9:00 a.m. UTC, traders monitoring the BTC/USDT spot market will have access to a detailed Spot CVD chart, which provides a deeper view of order flow and volume dynamics. This chart is particularly useful for understanding how buy and sell pressure evolves at different price levels, offering insights that go beyond simple price action.
Understanding the Spot CVD Chart Components
The Spot CVD chart is composed of two main panels. The upper panel displays a volume heatmap, which tracks trading activity at each price level. The heatmap’s brightness increases when the price consolidates in a range or makes a significant move, highlighting zones that may act as support or resistance in the near term. Traders often use these bright areas to anticipate potential price reactions.
The lower panel shows the cumulative volume delta (CVD), an indicator that measures the net difference between aggressive buying and selling. In this chart, the CVD line is color-coded by order size: the yellow line represents orders between $100 and $1,000, while the brown line tracks large orders ranging from $1 million to $10 million. When these lines rise, it indicates increasing buying pressure from that particular order size segment.
Why This Chart Matters for Traders
For active traders, the Spot CVD chart offers a granular view of market sentiment. By observing the CVD lines, one can gauge whether retail-sized orders (yellow) or institutional-sized orders (brown) are driving the market. A divergence between these lines can signal a shift in market dynamics, such as large players accumulating while smaller traders sell, or vice versa. This information can be valuable for making informed trading decisions, especially during periods of low liquidity or before major news events.
Interpreting Volume Heatmap and CVD Together
The combination of the volume heatmap and CVD provides a comprehensive picture. The heatmap reveals where trading activity has been concentrated, while the CVD shows the direction and magnitude of order flow. For example, if the heatmap shows a bright zone near a recent high and the CVD lines are declining, it may suggest that selling pressure is building at that level, potentially leading to a reversal. Conversely, a bright zone with rising CVD lines could indicate strong buying interest, offering a potential entry point.
Conclusion
The Spot CVD chart for BTC/USDT at 9:00 a.m. UTC on July 31 offers traders a valuable tool for analyzing order book dynamics. By understanding the volume heatmap and cumulative volume delta, market participants can gain a clearer picture of supply and demand, helping them navigate the volatile cryptocurrency market with more confidence. As always, it’s essential to use such indicators in conjunction with other analysis methods and risk management practices.
FAQs
Q1: What is the Spot CVD chart used for?
The Spot CVD chart is used to analyze order book data for the BTC/USDT spot trading pair. It combines a volume heatmap and cumulative volume delta to show trading activity and buy/sell pressure at different price levels, helping traders identify potential support and resistance zones.
Q2: How do I interpret the color-coded lines in the CVD panel?
The yellow line represents orders between $100 and $1,000, while the brown line tracks large orders between $1 million and $10 million. When these lines rise, it indicates increasing buying pressure from that order size segment; when they fall, it suggests selling pressure.
Q3: Can the Spot CVD chart predict price movements?
No indicator can predict price movements with certainty. The Spot CVD chart provides insights into order flow and market sentiment, which can help traders make more informed decisions. It should be used alongside other technical and fundamental analysis tools.
Disclaimer: The information provided is not trading advice, Bitcoinworld.co.in holds no liability for any investments made based on the information provided on this page. We strongly recommend independent research and/or consultation with a qualified professional before making any investment decisions.
