
2026-07-21
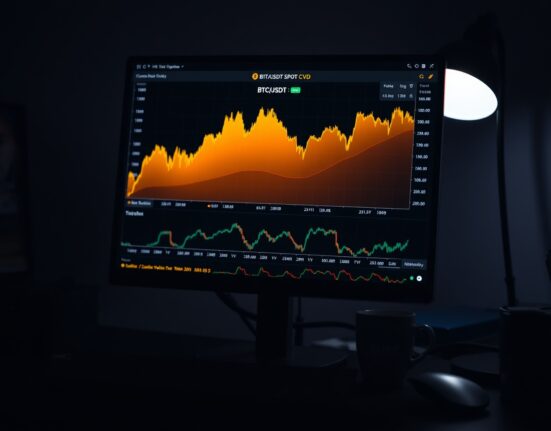
For traders monitoring Bitcoin’s price action, the Spot Cumulative Volume Delta (CVD) chart for the BTC/USDT trading pair on Binance offers a granular.

For traders monitoring Bitcoin’s price action, the Spot Cumulative Volume Delta (CVD) chart for the BTC/USDT trading pair on Binance offers a granular.

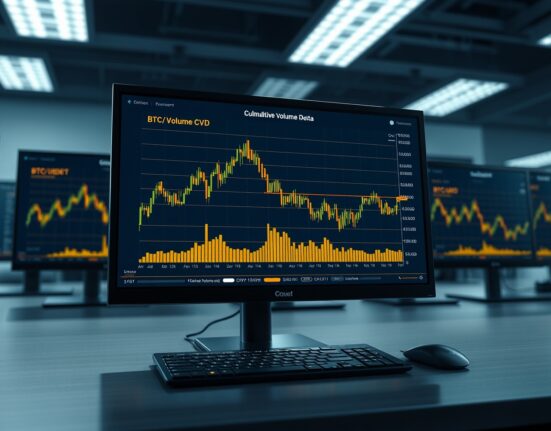
Bitcoin traders monitoring the BTC/USDT spot pair on July 14 observed notable activity in the Cumulative Volume Delta (CVD) and Volume Heatmap indicators..
At 10:00 a.m. UTC, the BTC/USDT spot Cumulative Volume Delta (CVD) chart offers traders a detailed view of order book dynamics, combining a.

The USD/CAD currency pair is showing early signs of a technical correction, with key oscillators beginning to cool from overbought territory. Analysts now.

The Spot Cumulative Volume Delta (CVD) chart for the BTC/USDT trading pair provides traders with a detailed view of order book dynamics and.

On June 3, 2024, at 00:00 UTC, the Bitcoin spot Cumulative Volume Delta (CVD) chart for the BTC/USDT pair offered a detailed snapshot.

The USD/CHF price forecast points to a significant technical development as the US Dollar approaches the 100-day Simple Moving Average (SMA). Momentum firms.
On April 27, 2025, at 12:00 a.m. UTC, traders closely examined the Spot CVD chart for the BTC/USDT trading pair. This analysis provides.

Market analysts closely examined the BTC/USDT spot Cumulative Volume Delta chart at 4 p.m. UTC on April 21, revealing significant insights into Bitcoin’s.

Market analysts closely examined the BTC spot Cumulative Volume Delta (CVD) chart for 10 a.m. UTC on April 20, 2025, identifying crucial trading.