
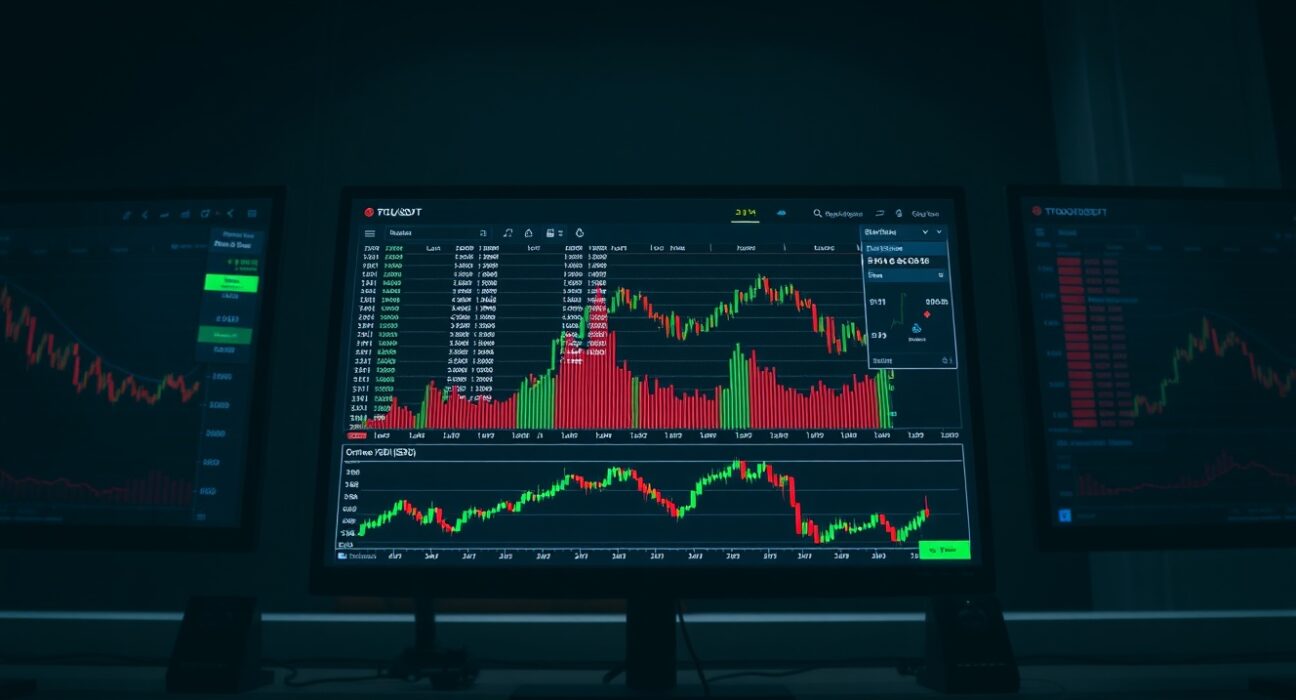
On July 3, 2025, the Spot Cumulative Volume Delta (CVD) chart for the BTC/USDT trading pair on Binance provides traders with a detailed view of order book dynamics. This tool, which combines a Volume Heatmap with a CVD indicator, offers insights into buying and selling pressure at specific price levels, helping identify potential support and resistance zones.
Understanding the Volume Heatmap
The top section of the Spot CVD chart features a Volume Heatmap that tracks trading volume across different price levels. When the price lingers in a particular range or makes a significant move, the heatmap background brightens. These brighter areas often indicate where significant trading activity has occurred, which can act as future support or resistance levels. For traders monitoring the BTC/USDT pair, this heatmap provides a visual representation of where liquidity is concentrated, offering clues about where the market might react.
Cumulative Volume Delta (CVD) Analysis
The lower portion of the chart displays the Cumulative Volume Delta (CVD) indicator, which categorizes buy and sell orders by size. Each colored line represents a specific order size range. For example, the yellow line tracks orders between $100 and $1,000, while the brown line monitors large orders ranging from $1 million to $10 million. A rising colored line indicates an increase in buy orders for that category, signaling growing demand at that order size.
Implications for Traders
By analyzing the CVD alongside the Volume Heatmap, traders can gauge the strength of buying or selling pressure at key price levels. For instance, if the heatmap shows a bright area around $60,000 and the CVD lines for large orders (brown) are rising, it may suggest strong institutional buying interest, potentially reinforcing that level as support. Conversely, a decline in buy orders for smaller categories (yellow) could indicate weakening retail demand. This combined analysis helps traders make more informed decisions about entry and exit points.
Conclusion
The Spot CVD chart for BTC/USDT offers a granular look at order flow and volume concentration. While the Volume Heatmap highlights areas of historical activity, the CVD indicator reveals the direction and size of current order flow. Together, they provide a powerful framework for understanding market dynamics, though traders should always consider broader market conditions and risk management strategies.
FAQs
Q1: What does a bright area on the Volume Heatmap indicate?
A bright area on the Volume Heatmap indicates that significant trading volume has occurred at that price level. This can act as a potential support or resistance zone because traders often react to these levels.
Q2: How is the Cumulative Volume Delta (CVD) different from regular volume?
Regular volume shows the total number of trades, while CVD breaks down volume by order size and categorizes it as buy or sell. This provides a more detailed view of market sentiment and the types of traders (retail vs. institutional) driving price movements.
Q3: Can the Spot CVD chart predict future price movements?
No indicator can predict price movements with certainty. The Spot CVD chart is a tool for analyzing current market conditions and order flow. It helps traders identify potential levels of interest but should be used in conjunction with other analysis methods and risk management.
Disclaimer: The information provided is not trading advice, Bitcoinworld.co.in holds no liability for any investments made based on the information provided on this page. We strongly recommend independent research and/or consultation with a qualified professional before making any investment decisions.