
2026-07-31
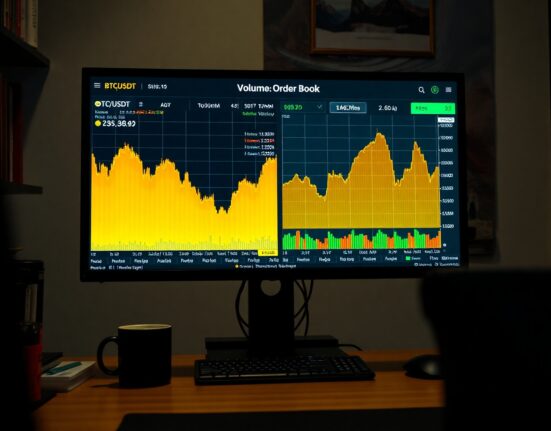
At 6:00 a.m. UTC on July 31, the Bitcoin spot market on Binance’s BTC/USDT pair presented a nuanced picture for traders tracking order.
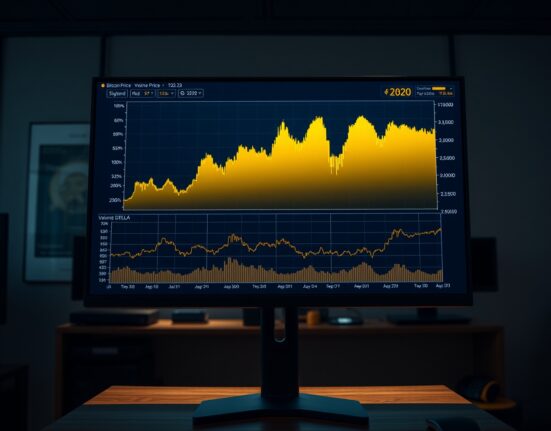
At 6:00 a.m. UTC on July 31, the Bitcoin spot market on Binance’s BTC/USDT pair presented a nuanced picture for traders tracking order.
For traders analyzing the BTC/USDT spot market, the Spot Cumulative Volume Delta (CVD) chart offers a granular view of order flow dynamics. Published.
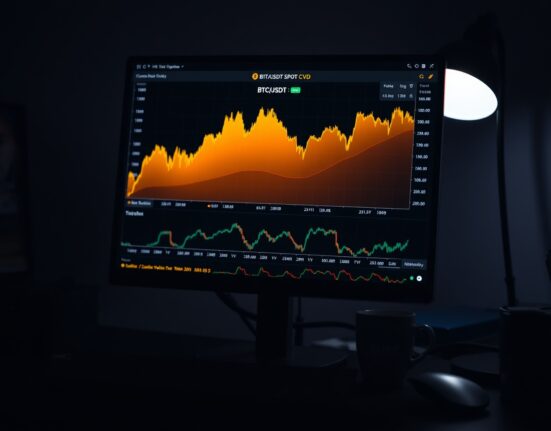
At 10:00 a.m. UTC, the BTC/USDT spot Cumulative Volume Delta (CVD) chart offers traders a detailed view of order book dynamics, combining a.

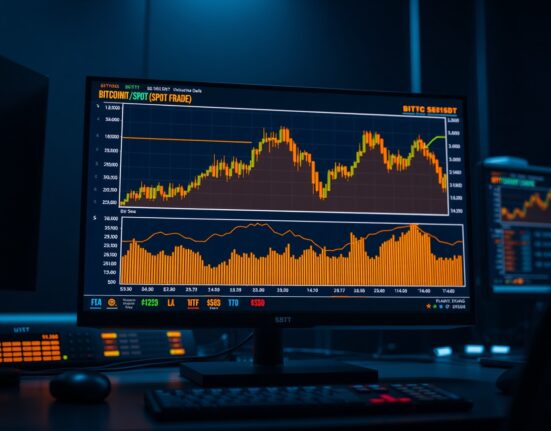
On July 4 at 5:00 a.m. UTC, the BTC/USDT spot Cumulative Volume Delta (CVD) chart provided a detailed snapshot of order flow dynamics..

On July 3, 2025, the Spot Cumulative Volume Delta (CVD) chart for the BTC/USDT trading pair on Binance provides traders with a detailed.

On July 1, 2025, the Spot Cumulative Volume Delta (CVD) chart for the BTC/USDT trading pair offers a detailed view of market microstructure,.

On June 30, the BTC/USDT spot Cumulative Volume Delta (CVD) chart provided traders with a detailed view of order book dynamics and volume.
On June 23 at 5:00 a.m. UTC, the BTC/USDT spot market presented a detailed picture of buyer and seller activity through the Cumulative.

Traders monitoring Bitcoin’s spot market on June 17, 2025, observed notable activity in the Cumulative Volume Delta (CVD) chart for the BTC/USDT pair..

As of 5:00 a.m. UTC on June 11, the BTC spot Cumulative Volume Delta (CVD) chart for the BTC/USDT pair reveals nuanced order.