
For traders analyzing Bitcoin price action on spot exchanges, the Cumulative Volume Delta (CVD) chart has become a widely used tool for assessing buying and selling pressure at specific price levels. Unlike simple volume bars, the CVD chart combines a volume heatmap with a delta-based indicator that categorizes trades by size, offering a more granular view of market dynamics.
Understanding the Volume Heatmap
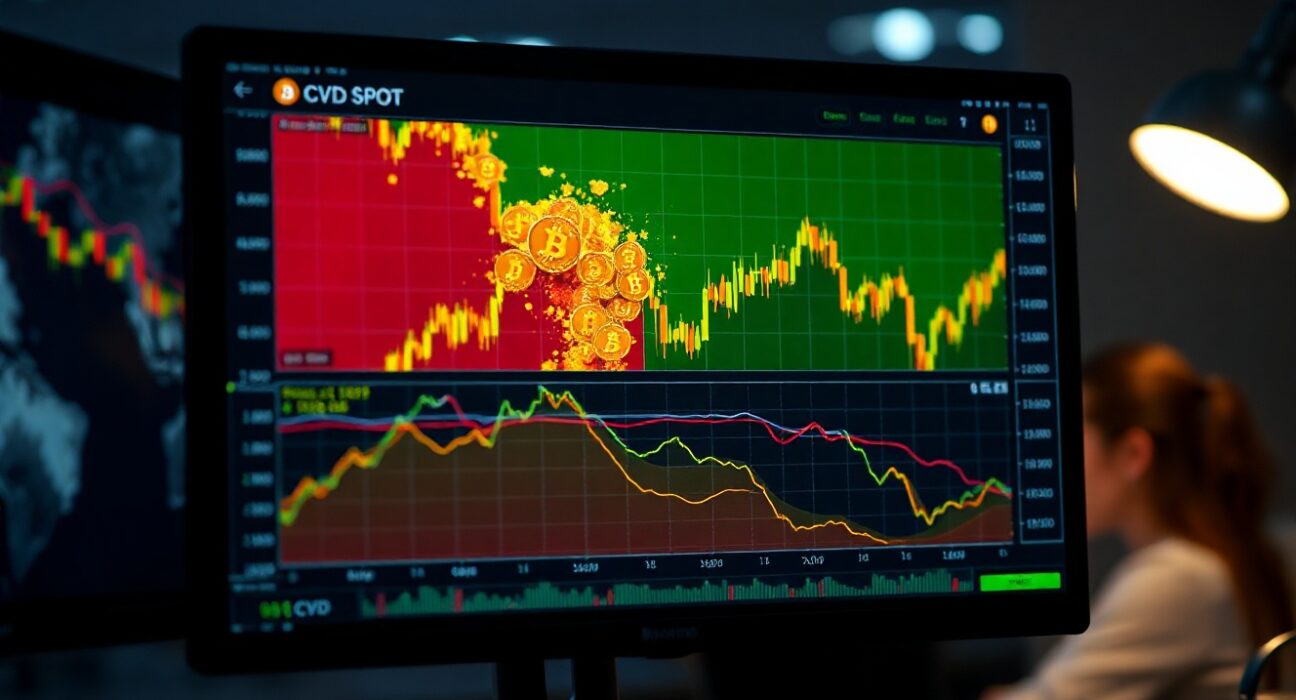
The upper section of the BTC spot CVD chart displays a volume heatmap. This visual representation tracks the total volume of trades executed at each price level over a given period. When the price lingers in a certain range or makes a sharp move, the background color in that area becomes brighter. These brighter zones often act as future support or resistance levels, as they represent price points where significant trading activity has already occurred. Traders use these zones to identify potential entry and exit points, as well as areas where the market may pause or reverse.
Interpreting the CVD Indicator
The lower section of the chart features the CVD indicator itself. This indicator plots lines that represent the net difference between buy and sell orders, categorized by trade size. Each line corresponds to a specific order size range. For example, the yellow line tracks orders between $100 and $1,000, while the brown line represents large institutional-sized orders between $1 million and $10 million. When the line for a given size category rises, it indicates that buy orders in that range are exceeding sell orders. A falling line suggests the opposite.
Why Trade Size Matters
By breaking down delta by trade size, the CVD chart helps traders distinguish between retail activity and institutional moves. A surge in the brown line (large orders) may signal that major players are accumulating or distributing Bitcoin, while movements in smaller-size lines often reflect retail sentiment. This layered view can provide earlier signals of trend changes than traditional volume analysis alone.
Practical Application for Traders
Traders commonly use the CVD chart in conjunction with price action and other technical indicators. For instance, if Bitcoin is approaching a price level that shows a bright heatmap zone from previous trading, and the CVD indicator for large orders begins to rise, this confluence may strengthen the case for a support level holding. Conversely, if the heatmap shows a bright zone but the CVD for large orders is declining, it may suggest that support is weakening. The key is to look for alignment between price levels, heatmap brightness, and CVD direction across multiple trade sizes.
Conclusion
The BTC spot CVD chart offers a more nuanced perspective on market participation than standard volume metrics. By combining a volume heatmap with trade-size-specific delta data, it helps traders identify meaningful support and resistance zones and gauge whether institutional or retail activity is driving price movements. As with any analytical tool, it is most effective when used as part of a broader trading strategy that includes risk management and confirmation from other indicators.
FAQs
Q1: What does CVD stand for in crypto trading?
CVD stands for Cumulative Volume Delta. It measures the net difference between buy and sell orders over time, helping traders assess whether buying or selling pressure is dominant at current price levels.
Q2: How is the volume heatmap different from regular volume bars?
Regular volume bars show total volume for a given time period. The volume heatmap displays volume at specific price levels, with brighter colors indicating higher activity. This makes it easier to identify price levels where significant trading has occurred, which may act as support or resistance.
Q3: Can the CVD chart predict price direction?
No single indicator can reliably predict price direction. The CVD chart is a tool for analyzing buying and selling pressure. It is most useful when combined with price action analysis, trend lines, and other technical indicators as part of a comprehensive trading strategy.
Disclaimer: The information provided is not trading advice, Bitcoinworld.co.in holds no liability for any investments made based on the information provided on this page. We strongly recommend independent research and/or consultation with a qualified professional before making any investment decisions.
