

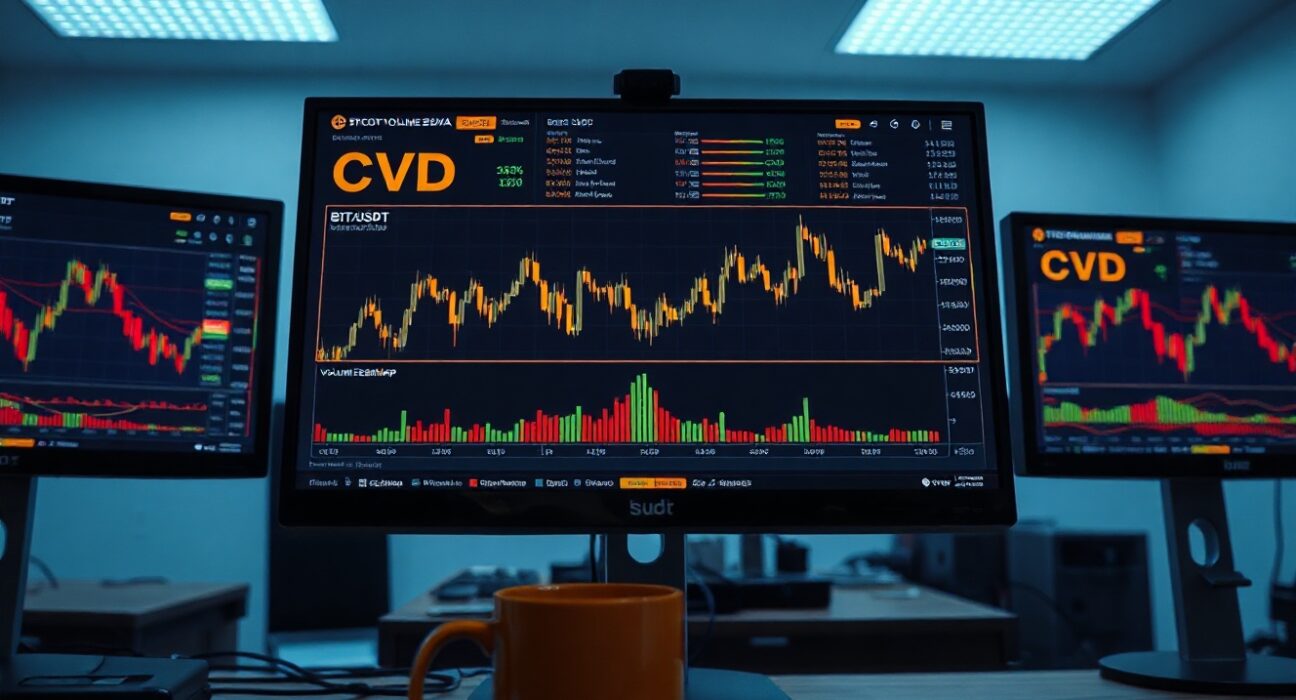
On July 9, 2025, the BTC/USDT spot market exhibited notable order book dynamics, as revealed by the Cumulative Volume Delta (CVD) and Volume Heatmap charts. These tools offer traders a granular view of buying and selling pressure at specific price levels, distinguishing between small and large trade sizes.
Understanding the Volume Heatmap
The top section of the chart displays a Volume Heatmap, which tracks the concentration of trading activity at each price level. Brighter areas on the heatmap indicate either prolonged price consolidation or significant price movement. These zones often act as future support or resistance levels, as traders tend to react to past areas of high activity. As of 6:00 a.m. UTC, the heatmap showed elevated brightness around the $58,000 and $62,000 levels, suggesting these are key thresholds to watch.
Cumulative Volume Delta (CVD) Breakdown by Trade Size
The CVD indicator below the heatmap separates buy and sell orders by trade size. The yellow line tracks orders between $100 and $1,000, representing retail and smaller institutional activity. The brown line tracks large orders between $1 million and $10 million, which are typically executed by major funds, market makers, or whales. As of the observation time, the brown line was rising steadily, indicating aggressive accumulation by large players, while the yellow line showed a more gradual increase, suggesting steady but less aggressive retail buying.
What This Means for Traders
The divergence between the two CVD lines is significant. When large orders dominate the buy side, it often signals that institutional or high-net-worth participants are positioning for a move. This can precede short-term volatility or a directional shift. However, traders should be cautious: large order flow can also be part of complex hedging or arbitrage strategies. The Volume Heatmap’s bright zones near $58,000 and $62,000 provide clear levels to monitor for potential breakouts or reversals.
Conclusion
The July 9 BTC/USDT order book data suggests that large-scale buyers are currently more active than smaller traders, with key price levels identified by the Volume Heatmap. While this does not guarantee a price move, it provides actionable context for traders monitoring market structure. As always, order book analysis should be combined with other indicators and broader market conditions for a complete picture.
FAQs
Q1: What is Cumulative Volume Delta (CVD) in crypto trading?
CVD tracks the net difference between buy and sell orders at each price level, helping traders gauge real-time buying or selling pressure. It can be filtered by trade size to distinguish retail from institutional activity.
Q2: How does the Volume Heatmap identify support and resistance?
The heatmap highlights price levels where high trading volume occurred. These levels often act as psychological barriers where traders remember past activity, making them likely areas for price reversals or breakouts.
Q3: Why is the distinction between small and large orders important?
Large orders ($1M–$10M) often signal institutional or whale activity, which can have a more sustained impact on price. Small orders ($100–$1K) reflect retail sentiment, which can be more reactive and less reliable for predicting medium-term moves.
Disclaimer: The information provided is not trading advice, Bitcoinworld.co.in holds no liability for any investments made based on the information provided on this page. We strongly recommend independent research and/or consultation with a qualified professional before making any investment decisions.
