

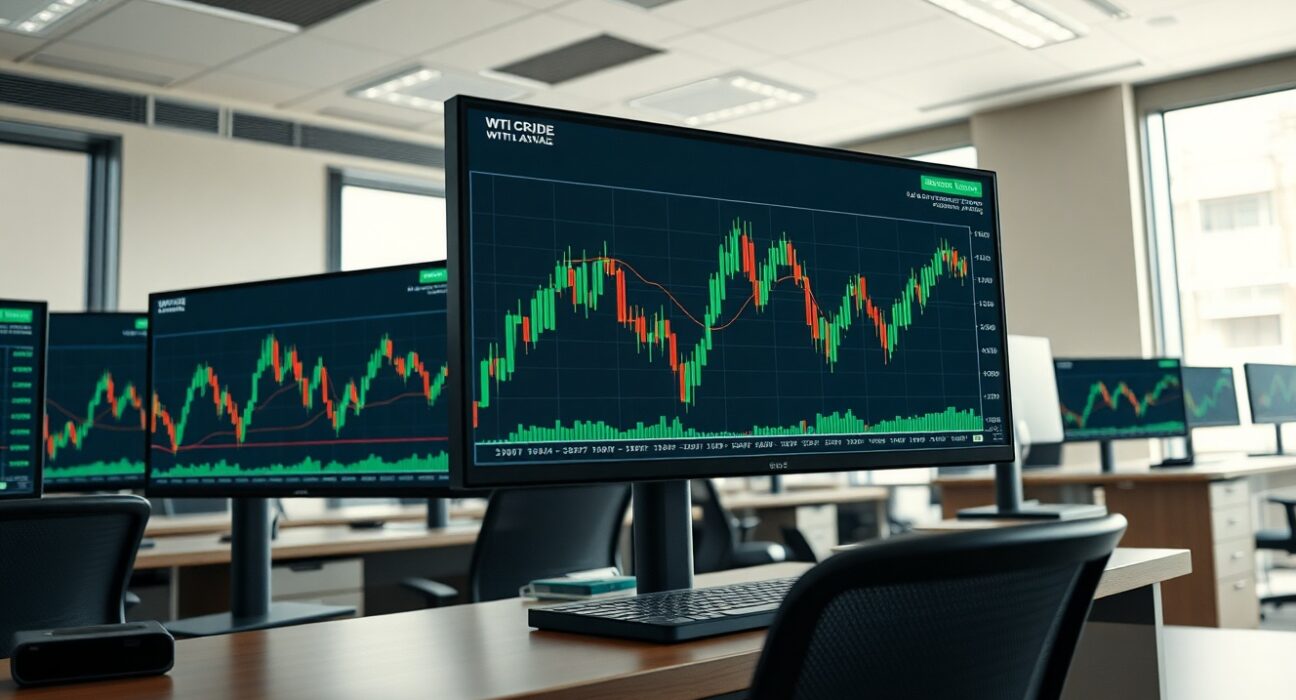
West Texas Intermediate (WTI) crude oil futures are testing a key technical resistance level as bullish momentum continues to drive prices higher. As of the latest trading session, the commodity has rallied toward the 100-day simple moving average (SMA), a closely watched indicator that often signals a shift in medium-term trend direction.
Technical Setup: 100-Day SMA in Focus
The 100-day SMA has acted as a significant barrier for WTI bulls in recent weeks. A sustained move above this level would confirm a strengthening uptrend and could open the door for further gains toward the next resistance zone near the 200-day SMA. However, repeated rejections at this level may indicate that sellers are still defending the broader downtrend from earlier in the year.
Momentum indicators, including the Relative Strength Index (RSI) and Moving Average Convergence Divergence (MACD), are currently pointing higher, supporting the bullish case. The RSI has moved above the neutral 50 level, suggesting that buying pressure is increasing, while the MACD line has crossed above its signal line, a classic bullish crossover.
Fundamental Drivers Supporting the Rally
The recent price action is underpinned by a combination of supply-side constraints and improving demand expectations. OPEC+ production cuts, particularly from Saudi Arabia and Russia, have tightened global supply, drawing down inventories. At the same time, demand forecasts from the International Energy Agency (IEA) and the U.S. Energy Information Administration (EIA) have been revised slightly higher, reflecting resilient economic activity in major consuming regions.
Geopolitical risks, including ongoing tensions in the Middle East and disruptions to Russian oil flows, have also added a risk premium to prices. Traders are closely monitoring any developments that could further disrupt supply chains.
What a Breakout Above the 100-Day SMA Would Mean
A confirmed close above the 100-day SMA would represent a technical victory for bulls, potentially attracting additional buying from momentum-driven funds and algorithmic traders. The next major target would be the 200-day SMA, currently positioned several dollars higher. A failure to break through, however, could lead to a pullback toward the 50-day SMA, which has provided support during recent dips.
Volume analysis will be key in the coming sessions. A breakout on above-average volume would lend credibility to the move, while a low-volume push above the SMA could signal a false breakout and trap late buyers.
Conclusion
WTI crude oil is at a critical juncture, with the 100-day SMA serving as the immediate battleground between bulls and bears. The technical setup favors the upside, supported by constructive fundamentals and bullish momentum indicators. Traders should watch for a decisive close above this level with strong volume to confirm the next leg higher. Until then, the market remains in a range-bound phase, with the outcome likely to set the tone for the weeks ahead.
FAQs
Q1: What is the 100-day SMA and why is it important for WTI?
The 100-day simple moving average is a widely followed technical indicator that smooths out price data over the past 100 trading days. It helps traders identify the medium-term trend. A break above or below this level is often seen as a confirmation of a trend change.
Q2: What are the key levels to watch for WTI crude oil?
Immediate resistance is at the 100-day SMA. A breakout above that targets the 200-day SMA. On the downside, support lies at the 50-day SMA, followed by recent swing lows near the $70 per barrel area.
Q3: How do OPEC+ production cuts affect WTI prices?
OPEC+ production cuts reduce global supply, which typically supports higher prices. When major producers like Saudi Arabia and Russia voluntarily cut output, it tightens the market and can lead to inventory drawdowns, pushing crude oil prices higher.
Disclaimer: The information provided is not trading advice, Bitcoinworld.co.in holds no liability for any investments made based on the information provided on this page. We strongly recommend independent research and/or consultation with a qualified professional before making any investment decisions.
