

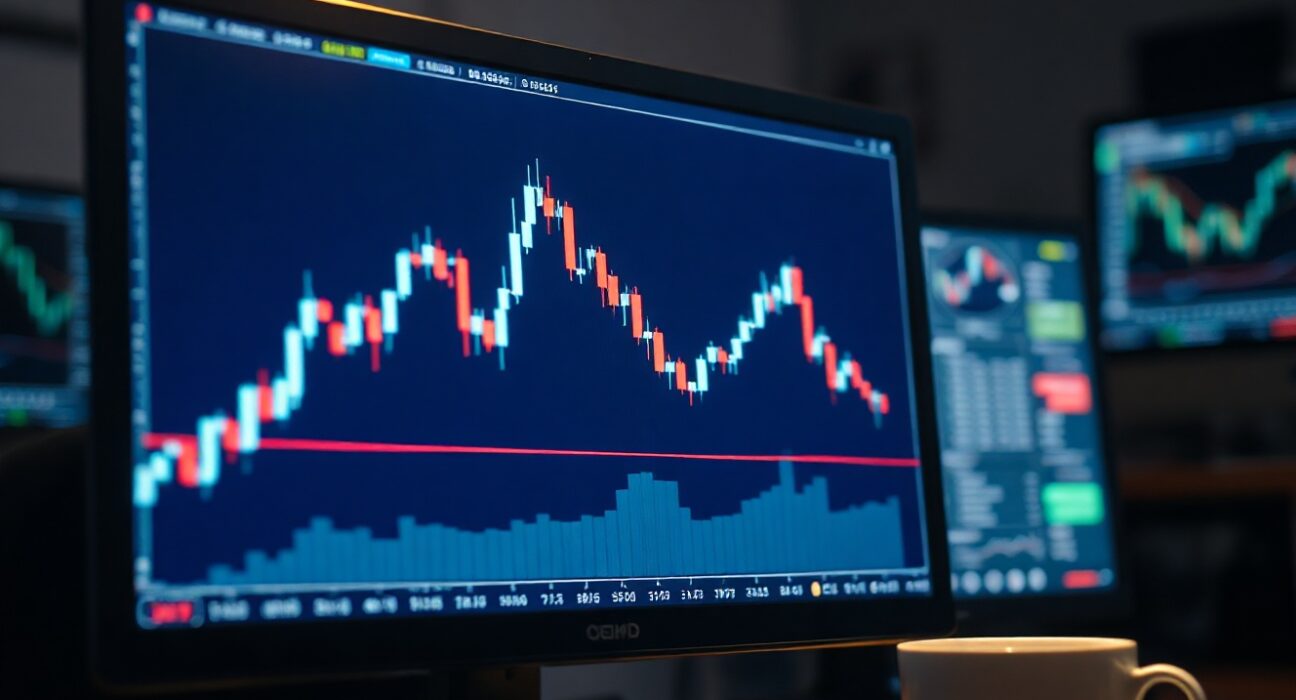
GBP/USD is trading around 1.3450, with buyers retaining control as the pair holds above the 100-hour simple moving average (SMA), signaling sustained bullish momentum in the short term.
Technical Outlook: Bulls Defend Key Support
The 100-hour SMA has emerged as a critical support level, with the pair repeatedly bouncing off this indicator over the past few sessions. As of the latest trading session, the pair remains above this threshold, suggesting that the immediate bias stays constructive. The next resistance is seen near 1.3500, a psychological level that could attract selling pressure if tested. On the downside, a break below the 100-hour SMA could expose the 1.3400 handle, where stronger support is located.
Market Drivers and Sentiment
The pound has found support from a softer US dollar, as market participants adjust their expectations for Federal Reserve policy. Recent US economic data has shown signs of cooling, which has weighed on the greenback. Meanwhile, the Bank of England’s cautious stance on rate cuts has provided additional support for sterling. However, traders remain cautious ahead of key UK inflation data and US jobless claims due later this week, which could inject volatility into the pair.
Why It Matters
For forex traders, the 1.3450 level represents a pivotal point. Holding above it keeps the bullish trend intact, while a sustained break below could signal a shift in momentum. The pair’s direction will likely depend on upcoming economic releases and central bank commentary, making this a key area to watch.
Conclusion
GBP/USD remains in a bullish posture as long as it stays above the 100-hour SMA, with immediate focus on the 1.3500 resistance. A break below the moving average would turn the spotlight back to 1.3400. Traders should monitor economic data and central bank signals for further direction.
FAQs
Q1: What is the 100-hour SMA and why is it important?
The 100-hour simple moving average is a technical indicator that smooths out price data over the past 100 hours. It is used by traders to identify the short-term trend direction and potential support or resistance levels.
Q2: What are the key levels to watch for GBP/USD?
Immediate resistance is at 1.3500, followed by 1.3550. On the downside, support is at the 100-hour SMA (currently near 1.3420), then 1.3400 and 1.3350.
Q3: How could upcoming UK inflation data affect GBP/USD?
If UK inflation comes in higher than expected, it could reduce the likelihood of near-term Bank of England rate cuts, which would likely boost the pound. Conversely, softer inflation could weigh on sterling.
Disclaimer: The information provided is not trading advice, Bitcoinworld.co.in holds no liability for any investments made based on the information provided on this page. We strongly recommend independent research and/or consultation with a qualified professional before making any investment decisions.
