

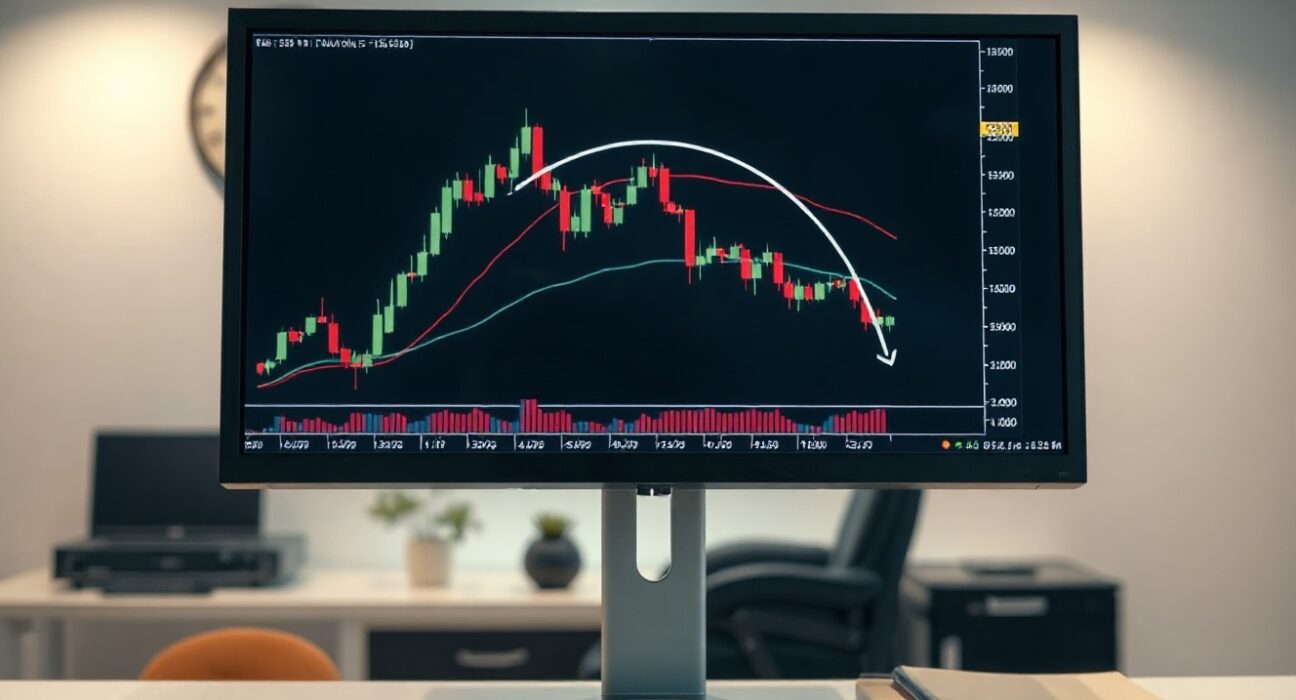
The USD/CHF currency pair faced a notable technical rejection at the 1.0000 (100%) Fibonacci Arc level, a development that technical analysts suggest could pave the way for a decline toward the 0.8040 support zone. This price action, observed in recent trading sessions, marks a critical juncture for the pair after a period of attempted recovery.
Technical Breakdown: The 100% Arc Rejection
The 1.0000 level, identified as the 100% Fibonacci Arc, has acted as a formidable resistance barrier. This specific technical indicator is derived from a significant prior price swing, and its retest often dictates the medium-term directional bias. The recent rejection at this level is significant because it signals that selling pressure remains dominant, overwhelming the buying momentum that had previously pushed the pair higher. For traders, this rejection provides a clear bearish signal, suggesting that the corrective uptrend has likely exhausted itself.
Key Support Targets and Market Implications
With the rejection confirmed, the focus now shifts to the downside. The immediate and primary target for this potential decline is the 0.8040 level, a zone that has historically provided strong support. A successful move toward this level would represent a substantial correction from the current price point. The journey to 0.8040 is unlikely to be linear; the pair may encounter intermediate support levels that could temporarily stall the decline. However, the technical setup suggests that the path of least resistance is to the downside as long as the pair remains below the 1.0000 Arc. This bearish outlook is further reinforced by broader market dynamics, where the US Dollar’s strength is being questioned against safe-haven currencies like the Swiss Franc, particularly during periods of global economic uncertainty.
Why This Matters for Forex Traders
For forex traders, this technical signal is a crucial piece of information for risk management and trade planning. The rejection at a major technical level like the 100% Arc is often used as a trigger for initiating short positions or for adjusting existing long positions. Understanding the significance of this level helps traders anticipate potential market moves and set appropriate stop-loss orders above the resistance to limit risk. The 0.8040 target provides a clear objective for profit-taking. This analysis underscores the importance of technical levels in the forex market, where psychological and mathematical price points often dictate market behavior. The ability to identify and react to these levels is a core skill for traders navigating the volatile currency markets.
Conclusion
The USD/CHF pair’s rejection at the 1.0000 (100%) Fibonacci Arc is a significant technical event that has shifted the short-term outlook to bearish. The clear target of 0.8040 offers a defined path for traders, while the resistance at 1.0000 serves as a critical invalidation point. As the pair navigates this potential downward move, market participants will closely watch price action for confirmation of the trend, making this a key development in the forex market.
FAQs
Q1: What is a Fibonacci Arc?
A Fibonacci Arc is a technical analysis tool used to identify potential support and resistance levels. It consists of three curved lines drawn from a high or low point, based on Fibonacci ratios (e.g., 38.2%, 50%, 61.8%, 100%). These arcs help traders visualize potential price reversal zones.
Q2: Why is the 1.0000 (100%) level significant?
The 100% level of a Fibonacci Arc represents a full retracement of the initial price move used to draw the arcs. It is considered a major psychological and technical level. A rejection here often indicates a strong continuation of the prior trend, in this case, a downtrend.
Q3: Is the 0.8040 target guaranteed?
No, technical analysis targets are not guaranteed. They are based on historical price patterns and probabilities. The 0.8040 level is a significant support zone, but various fundamental news events or shifts in market sentiment could alter the price path, leading to a break below or a reversal before the target is reached.
Disclaimer: The information provided is not trading advice, Bitcoinworld.co.in holds no liability for any investments made based on the information provided on this page. We strongly recommend independent research and/or consultation with a qualified professional before making any investment decisions.
