

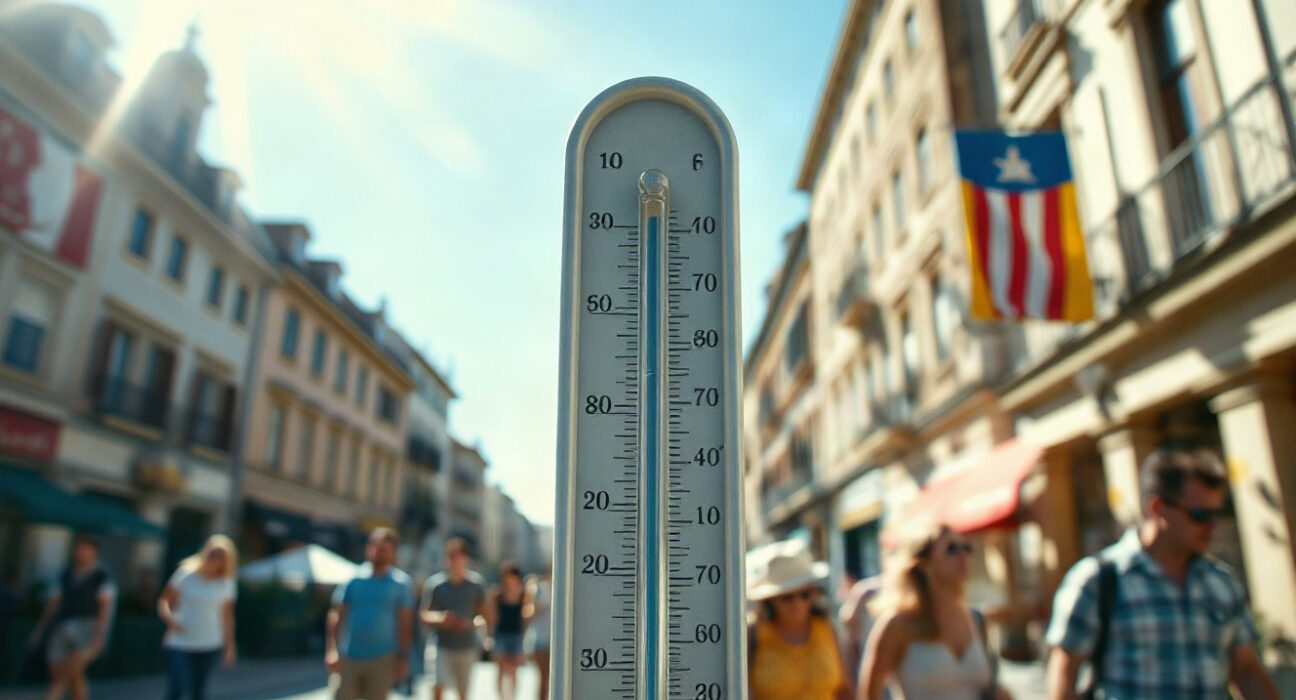
A recent heatwave has had only a marginal impact on the broader economy, according to data visualizations that track key indicators across affected regions. The charts, which compile temperature readings alongside economic activity metrics, show that while the heatwave was notable for its duration and intensity, its economic consequences remained limited, with most sectors showing only minor fluctuations.
Understanding the Data Behind the Charts
The charts in question present a side-by-side comparison of temperature anomalies and economic performance indicators, such as retail footfall, energy consumption, and construction activity. As of the latest data, these indicators have not shown significant deviations from seasonal norms, suggesting that businesses and consumers have adapted to extreme weather conditions through measures like adjusted working hours and increased cooling usage.
This resilience is partly due to the nature of the heatwave, which, while intense, did not coincide with major holidays or supply chain disruptions. Additionally, many industries, particularly those in the service sector, have implemented heat action plans that mitigate productivity losses.
Contextualizing the Economic Impact
Historically, heatwaves can strain power grids and reduce labor productivity, especially in outdoor sectors like agriculture and construction. However, the current data indicates that these effects have been largely localized and short-lived. For instance, energy demand has risen, but not to levels that would trigger emergency protocols or cause widespread outages.
Moreover, the charts reveal that consumer spending patterns have remained stable, with a slight uptick in sectors like food and beverage, as people seek refreshments and indoor activities. This suggests that the heatwave’s impact is more redistributive than destructive, shifting spending rather than reducing it.
Why This Matters for Readers
Understanding the marginal economic impact of extreme weather events is crucial for policymakers and businesses. It helps in allocating resources for climate adaptation and in setting realistic expectations for economic forecasting. The data also underscores the effectiveness of existing heatwave preparedness measures, which may serve as a model for other regions facing similar climate challenges.
Conclusion
In summary, the heatwave’s economic impact has been marginal, as illustrated by the accompanying charts. While extreme weather remains a concern, this instance shows that with proper planning and adaptation, the economic fallout can be contained. As climate patterns evolve, continued monitoring and analysis will be essential to maintain this resilience.
FAQs
Q1: What does ‘marginal economic impact’ mean in this context?
It means that the heatwave had a minimal effect on overall economic activity, with only slight changes in indicators like retail sales, energy use, and productivity, not enough to significantly alter economic forecasts.
Q2: How do charts show economic impact?
The charts compare temperature data with economic indicators over time, allowing analysts to visualize any correlations or deviations from normal patterns, thus illustrating the extent of the impact.
Q3: Are there any sectors that were hit harder than others?
Yes, sectors like outdoor construction and agriculture may have experienced more noticeable effects, but these were not large enough to affect the overall economic picture, as the charts indicate.
Disclaimer: The information provided is not trading advice, Bitcoinworld.co.in holds no liability for any investments made based on the information provided on this page. We strongly recommend independent research and/or consultation with a qualified professional before making any investment decisions.
