

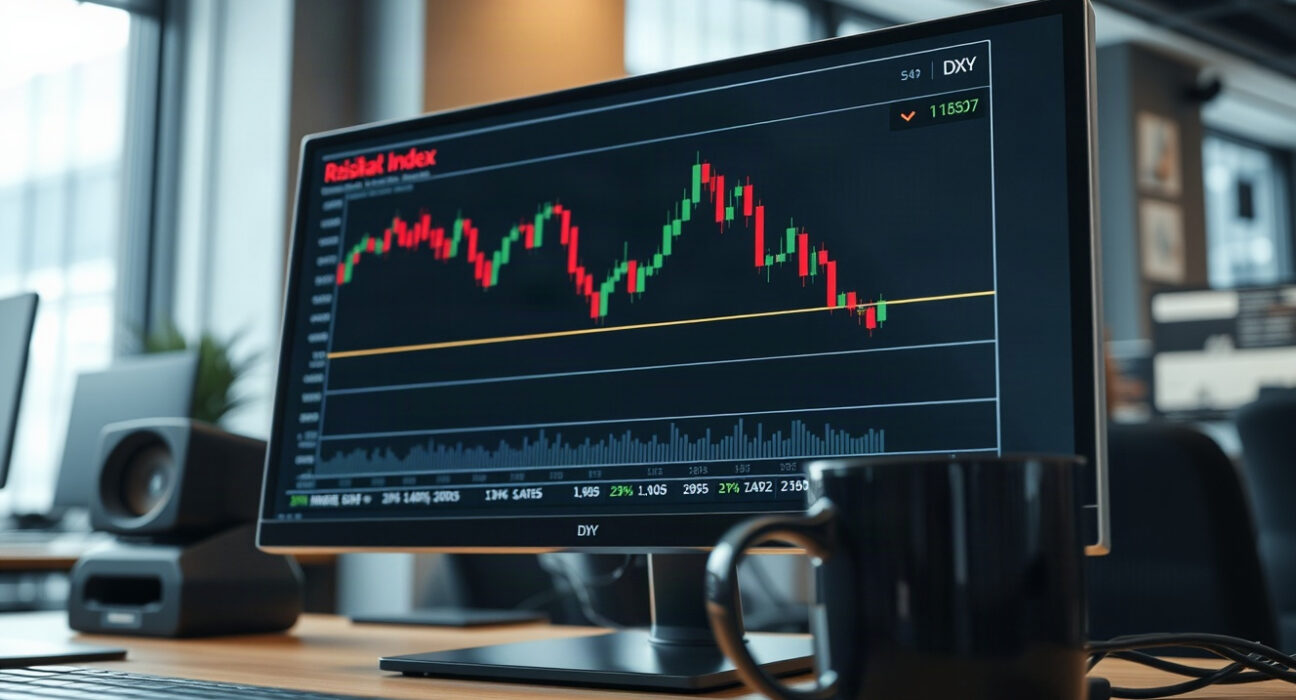
The US Dollar Index (DXY) continues to face selling pressure, with the 200-day simple moving average (SMA) acting as a formidable ceiling for any recovery attempts. As of the latest trading session, the greenback remains entrenched in a bearish technical structure, leaving traders cautious about the near-term outlook.
Technical Setup: Resistance at the 200-Day SMA
The 200-day SMA has repeatedly rejected upside moves, reinforcing the bearish bias. This key moving average, often watched by institutional traders as a long-term trend indicator, has capped rallies since the index turned lower. The repeated failure to break above this level suggests that sellers are committed to defending the resistance zone.
Momentum indicators, including the Relative Strength Index (RSI), are hovering in neutral-to-weak territory, offering no clear bullish divergence. Meanwhile, the moving average convergence divergence (MACD) remains below its signal line, confirming the downward momentum. Support levels are seen near recent swing lows, but a break below those could accelerate losses.
Market Drivers: What’s Weighing on the Dollar?
The dollar’s weakness is largely tied to shifting expectations around Federal Reserve policy. With inflation showing signs of cooling, markets have priced in a more dovish path for interest rates, reducing the yield advantage that previously supported the greenback. Additionally, improving global growth prospects and a rebound in risk appetite have diminished the dollar’s safe-haven appeal.
Geopolitical developments and central bank actions outside the US also play a role. For instance, if the European Central Bank or the Bank of Japan signal tighter policy, their currencies could strengthen further against the dollar, adding to DXY’s downside.
Implications for Traders and Investors
For forex traders, the persistent rejection at the 200-day SMA suggests a strategy of selling rallies rather than buying dips. A decisive close above this level, however, would signal a potential trend reversal and could trigger short-covering. Investors with international exposure should monitor these levels closely, as a weaker dollar has broad implications for commodities, emerging market assets, and multinational earnings.
Conclusion
In summary, the US Dollar Index remains under bearish control, with the 200-day SMA acting as a key resistance. While the broader trend is down, traders should watch for a breakout or breakdown to confirm the next directional move. As always, staying informed on central bank communications and macroeconomic data will be essential for navigating the currency markets.
FAQs
Q1: What is the US Dollar Index (DXY)?
The US Dollar Index measures the value of the US dollar against a basket of six major currencies: the euro, Japanese yen, British pound, Canadian dollar, Swedish krona, and Swiss franc. It is a widely used benchmark for the dollar’s overall strength.
Q2: Why is the 200-day SMA important in technical analysis?
The 200-day simple moving average is a long-term trend indicator. When the price is below it, the trend is considered bearish; when above, bullish. It often acts as a support or resistance level, and a break above or below can signal a trend change.
Q3: How does Federal Reserve policy affect the US Dollar Index?
The Fed’s interest rate decisions directly influence the dollar’s value. Higher rates tend to attract foreign capital, boosting the dollar, while lower rates or expectations of cuts can weaken it. Traders closely watch Fed statements and economic data for clues on future policy.
Disclaimer: The information provided is not trading advice, Bitcoinworld.co.in holds no liability for any investments made based on the information provided on this page. We strongly recommend independent research and/or consultation with a qualified professional before making any investment decisions.
