

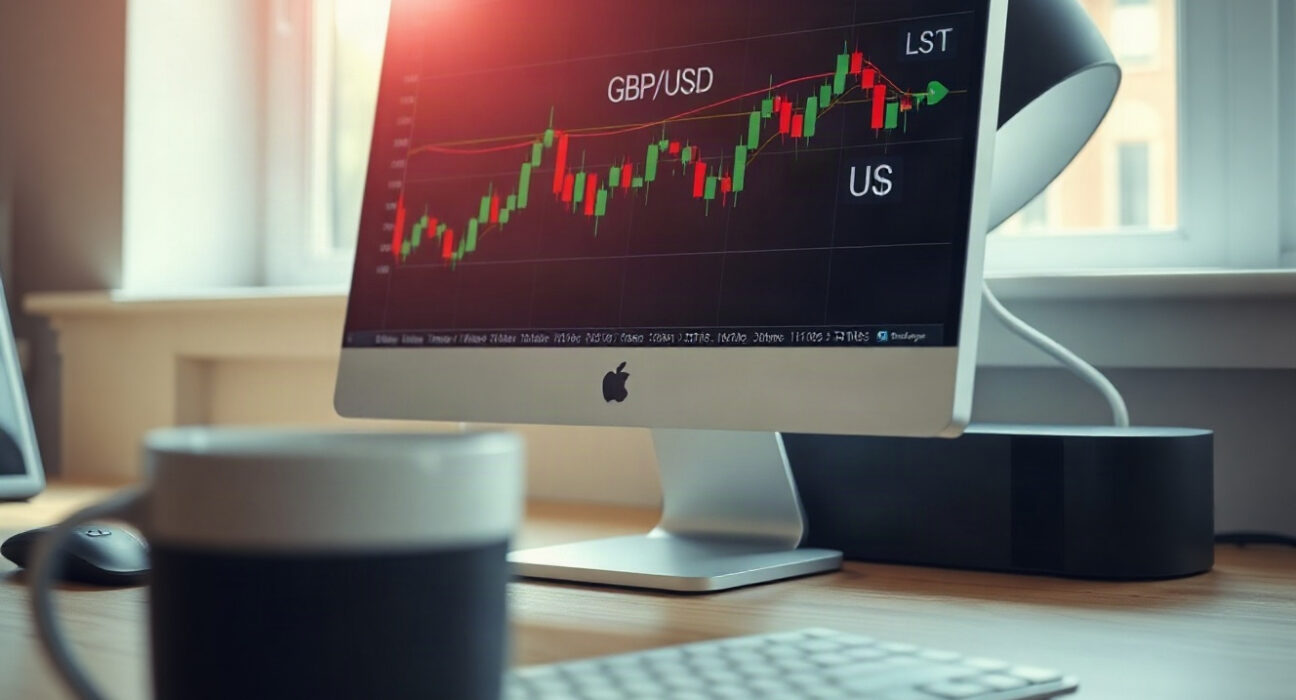
GBP/USD slipped below the 1.3550 level in recent trading, yet the pair continues to hold above its 100-day simple moving average (SMA), preserving a broadly bullish technical bias for the near term.
Technical Outlook: Support Levels and Bullish Signals
The 100-day SMA has acted as a key support zone, with the pair repeatedly bouncing off this level in recent sessions. As of this writing, the exchange rate is hovering around 1.3520, down from the intraday high of 1.3575. The fact that the pair remains above the 100-day SMA suggests that buyers are still in control, and the latest pullback may be viewed as a healthy correction within an uptrend.
Immediate resistance is seen at the 1.3550 handle, followed by the 1.3600 psychological level. On the downside, the 100-day SMA, currently near 1.3480, provides the first line of defense. A decisive break below that could open the door for a test of the 200-day SMA around 1.3350, which would negate the bullish bias.
Market Drivers: Dollar Strength and UK Economic Data
The recent decline in GBP/USD is largely attributed to a firmer US dollar, as markets reassess the Federal Reserve’s policy path. Stronger-than-expected US economic data, particularly in the labor market, has led traders to scale back expectations of aggressive rate cuts in 2025. This has boosted US Treasury yields and supported the greenback.
On the UK side, the Bank of England has maintained a cautious stance, with policymakers signaling that inflation remains above target. Upcoming UK GDP and inflation figures will be crucial in determining whether the BoE can hold rates steady or is forced to ease. Any dovish surprise from the BoE could weigh on the pound, while a hawkish surprise would likely lift GBP/USD back above 1.3600.
Why This Matters for Currency Traders
For traders, the key takeaway is that the bullish structure remains intact as long as the 100-day SMA holds. The current dip could offer a buying opportunity for those who follow trend-following strategies. However, the pair is at a critical juncture, and a close below the 100-day SMA would signal a potential trend reversal. Monitoring upcoming economic releases and central bank commentary will be essential for gauging the next directional move.
Conclusion
GBP/USD remains above its 100-day SMA despite slipping below 1.3550, keeping the bullish bias alive. The pair is at a pivotal point, with support at the 100-day SMA and resistance at 1.3550 and 1.3600. Traders should watch for a break in either direction, driven by upcoming US and UK economic data.
FAQs
Q1: What is the 100-day SMA and why is it important?
The 100-day simple moving average (SMA) is a widely followed technical indicator that smooths price data over the past 100 days. It is used by traders to gauge the medium-term trend. When the price is above the 100-day SMA, it generally indicates an uptrend, and the level often acts as support.
Q2: What does it mean when GBP/USD holds above the 100-day SMA?
Holding above the 100-day SMA suggests that the underlying trend remains bullish. It indicates that buyers are stepping in at that level, and the recent decline is seen as a pullback within an uptrend rather than a reversal.
Q3: What could cause GBP/USD to break below the 100-day SMA?
A break below the 100-day SMA could be triggered by a stronger US dollar, disappointing UK economic data, or a more hawkish-than-expected Federal Reserve. If that happens, the bearish bias would likely dominate, with the next support around the 200-day SMA.
Disclaimer: The information provided is not trading advice, Bitcoinworld.co.in holds no liability for any investments made based on the information provided on this page. We strongly recommend independent research and/or consultation with a qualified professional before making any investment decisions.
