
Hey crypto enthusiasts! The Tron (TRX) market is showing some exciting activity, and if you’ve been keeping an eye on TRX, you’ll want to hear this. After establishing a solid foundation above $0.0590, TRX has embarked on a fresh upward trajectory against the US Dollar. Let’s break down what’s fueling this potential rally and what key levels to watch.
TRX Breaks Key Resistance – What Does It Mean?
Tron’s price action has been undeniably positive recently. After successfully breaching the $0.0600 and $0.0612 resistance barriers, TRX officially stepped into bullish territory. This move isn’t just random; it’s backed by technical indicators suggesting a potential continued climb.
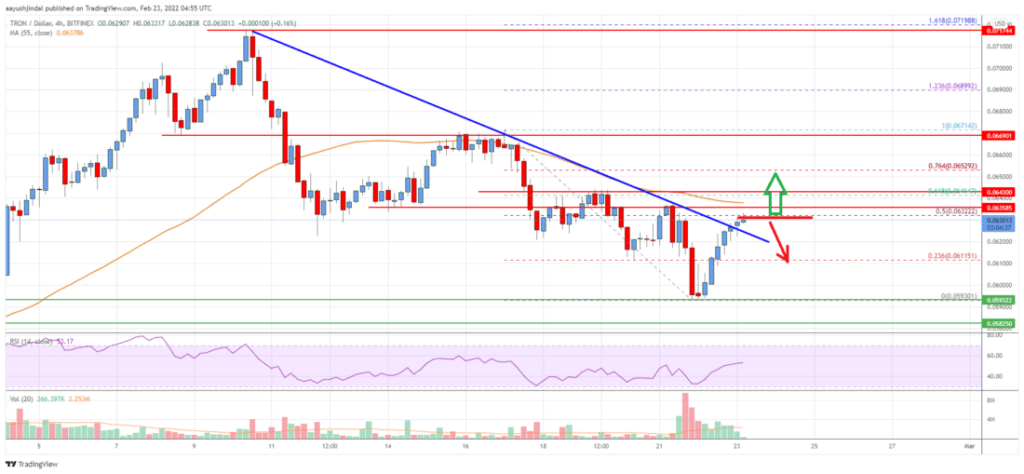
Specifically, TRX has surged past the 23.6% Fibonacci retracement level. For those unfamiliar, Fibonacci retracement levels are like potential areas of support or resistance based on mathematical ratios found in nature and, surprisingly, in market trends! This particular level is measured from the recent dip from $0.0671 down to $0.0592. Adding to the bullish momentum, TRX also busted through a significant downtrend line on the 4-hour chart, which was acting as resistance around $0.0622. Think of it like breaking free from a ceiling!
Key Hurdles and Potential Targets for TRX
Currently, TRX is facing a bit of a challenge around the $0.0632 mark. This area is proving to be a short-term resistance. Interestingly, this level is also near the 50% Fibonacci retracement of the recent drop (from $0.0671 to $0.0592). Fibonacci levels often cluster around areas where price might pause or reverse, so this resistance is definitely something to watch.
Adding to the resistance mix is the 55-period Simple Moving Average (SMA) on the 4-hour chart, hovering around $0.0640. Moving averages smooth out price data over a period, and the 55 SMA is often used to identify medium-term trends.
Key Resistance Levels to Watch:
- $0.0632: Current short-term resistance and 50% Fibonacci retracement.
- $0.0640: 55-period Simple Moving Average (4-hour chart).
- $0.0670: Previous swing high and a significant resistance zone.
What needs to happen for a stronger bullish rally?
For TRX to truly kick into high gear, it needs to decisively close above $0.0640. Think of this as clearing a major hurdle. If TRX can manage this, we could see a rapid ascent towards the $0.0670 resistance level. And if that level is conquered? Buckle up! Analysts suggest this could pave the way for a more substantial rally, potentially targeting $0.0720 in the near term.
Potential Downside Risks and Support Levels
Of course, the crypto market is known for its volatility, and it’s crucial to consider potential downside scenarios. If TRX faces selling pressure, there are key support levels that could cushion any drops.
Key Support Levels to Monitor:
- $0.0620: Immediate support and the area of the broken downtrend line.
- $0.0600: Stronger support level. A break below this could signal a more significant pullback.
- $0.0565: Potential level if $0.0600 support fails.
- $0.0550: Another crucial support zone. Breaking below this might open the door to a deeper correction towards $0.0520.
Important Note: A break below the $0.0600 support could trigger a rapid price decline. Traders should be prepared for this possibility and consider risk management strategies.
TRX Price Prediction: Bullish Outlook if Resistance Breaks
Let’s recap. Currently trading below $0.0640 and near the 55 SMA on the 4-hour chart, TRX is at a crucial juncture. The technical indicators suggest a bullish bias, but breaking through the $0.0640 resistance zone is the key to unlocking further upside potential.
In a Nutshell:
- Bullish Scenario: Sustained trading above $0.0640 could propel TRX towards $0.0670 and potentially $0.0720.
- Bearish Scenario: Failure to hold $0.0600 support could lead to further declines towards $0.0565, $0.0550, and even $0.0520.
Actionable Insights for Traders:
- Watch $0.0640 Resistance: A breakout above this level could be a buy signal for short-term traders.
- Monitor Support Levels: Keep a close eye on $0.0620 and $0.0600 as potential support zones.
- Risk Management: Always use stop-loss orders to manage risk, especially in the volatile crypto market.
Source: TradingView
Disclaimer: This analysis is for informational purposes only and not financial advice. Cryptocurrency trading involves significant risk. Always do your own research and consult with a financial advisor before making any investment decisions.
Related Reads:
– Ferrari joins the NFT universe through a collaboration with a Swiss…
Disclaimer: The information provided is not trading advice, Bitcoinworld.co.in holds no liability for any investments made based on the information provided on this page. We strongly recommend independent research and/or consultation with a qualified professional before making any investment decisions.