The Australian dollar faces mounting pressure against its US counterpart as technical charts reveal a concerning pattern developing around the psychologically significant 0.7000 level. Market analysts globally are closely monitoring the AUD/USD pair this week, particularly as price action tests critical moving average support that has held for months. Consequently, traders are preparing for potential volatility as fundamental economic factors converge with technical signals.
AUD/USD Technical Analysis: Bears Control Near 0.7000
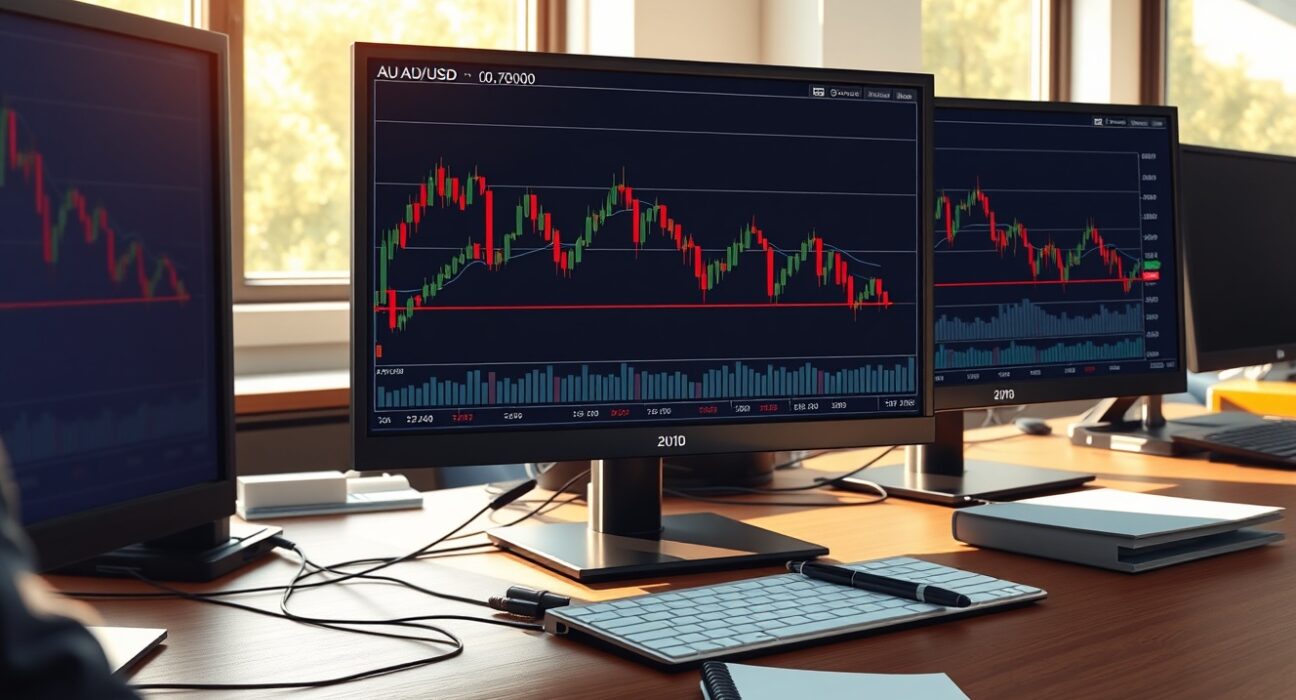
Technical indicators currently show bears maintaining control over the AUD/USD currency pair. The exchange rate has consistently faced resistance below the 0.7100 level throughout recent trading sessions. Moreover, daily chart analysis reveals a series of lower highs developing since mid-month. Price action now tests the 0.7020 support zone, which previously provided substantial buying interest during earlier declines.
Several key technical factors contribute to the current bearish outlook:
- Moving Average Convergence: The 50-day and 100-day exponential moving averages have crossed below the 200-day EMA
- Momentum Indicators: The Relative Strength Index (RSI) remains below the 50 midline, indicating bearish momentum
- Volume Analysis: Downward moves have occurred on increasing volume, suggesting conviction
- Support Levels: Multiple tests of the 0.7020-0.7000 zone have weakened its structural integrity
Market participants particularly note the significance of the 0.7000 psychological level. Historically, this threshold has served as both strong support and resistance depending on broader market conditions. Currently, repeated tests suggest weakening buyer commitment at this crucial juncture.
200-EMA Breakdown: Technical Implications and Historical Context
The 200-period exponential moving average represents a critical long-term trend indicator for currency traders. A sustained break below this level typically signals significant trend changes. Currently, the AUD/USD pair tests this moving average on multiple timeframes, creating a convergence of technical pressure.
Historical data reveals important context for 200-EMA behavior in this currency pair:
| Period | 200-EMA Break | Subsequent Movement | Duration |
|---|---|---|---|
| March 2023 | Bearish | -4.2% over 6 weeks | 42 days |
| August 2022 | Bearish | -6.8% over 9 weeks | 63 days |
| January 2024 | Bullish | +3.5% over 5 weeks | 35 days |
This historical perspective demonstrates that 200-EMA breaks often precede sustained directional moves. The current test occurs amid shifting global monetary policy expectations, potentially amplifying any breakdown’s significance. Additionally, institutional positioning data shows increased short exposure to the Australian dollar among hedge funds and asset managers.
Fundamental Drivers: Economic Factors Influencing AUD/USD
Beyond technical patterns, fundamental economic developments contribute substantially to the AUD/USD outlook. The Reserve Bank of Australia’s recent policy statements have highlighted concerns about domestic economic growth. Meanwhile, the US Federal Reserve maintains a comparatively hawkish stance on interest rates.
Several key fundamental factors currently influence the currency pair:
- Interest Rate Differentials: The US-Australia yield spread has widened in favor of the US dollar
- Commodity Prices: Iron ore and copper prices, crucial Australian exports, show recent weakness
- Economic Data: Australian employment figures surprised to the downside last month
- Global Risk Sentiment: Equity market volatility typically impacts commodity currencies like the AUD
Furthermore, China’s economic recovery pace directly affects Australian export prospects. Recent manufacturing data from China suggests slower-than-expected growth, potentially reducing demand for Australian raw materials. This connection remains crucial for AUD valuation against major trading partners.
Market Structure and Trader Positioning Analysis
Commitment of Traders reports reveal shifting positioning in AUD futures markets. Commercial hedgers have increased their long exposure recently, suggesting underlying business demand at current levels. However, leveraged funds continue building short positions, creating conflicting signals about near-term direction.
Options market analysis provides additional insight into trader expectations. The volatility skew for AUD/USD options shows increased demand for downside protection. Specifically, put options at the 0.6950 strike price trade at elevated premiums compared to calls at equivalent distances from current spot prices. This pricing dynamic indicates market participants perceive greater risk of further declines.
Market microstructure analysis reveals important liquidity patterns. Trading volume typically increases during Asian and European session overlaps, creating potential volatility windows. Additionally, algorithmic trading systems appear particularly active around the 0.7000 level, potentially exacerbating moves through this psychological threshold.
Expert Perspectives: Institutional Analysis and Forecasts
Major financial institutions have published varied but generally cautious outlooks for the AUD/USD pair. Commonwealth Bank of Australia analysts note that “the technical picture has deteriorated meaningfully” in recent weeks. They highlight the importance of the 0.6980 support level, suggesting a break could trigger stops toward 0.6900.
Conversely, some analysts see potential for stabilization. Westpac Banking Corporation strategists point to valuation metrics suggesting the Australian dollar appears undervalued relative to long-term averages. They note that “positioning extremes often precede reversals” in currency markets, suggesting the current bearish consensus might represent a contrarian opportunity.
Independent technical analysts emphasize chart patterns developing on weekly timeframes. A potential head-and-shoulders pattern has formed over several months, with the neckline around the 0.7000 level. A confirmed break below this pattern would project substantially lower targets, according to classical technical analysis principles.
Risk Management Considerations for Traders
Professional traders emphasize specific risk management approaches during such technically significant periods. Position sizing typically decreases when trading near major support or resistance levels. Additionally, many institutional traders employ options strategies to define risk while maintaining exposure to potential breakouts.
Several key risk management principles apply to the current AUD/USD situation:
- Stop Placement: Technical traders often place stops above recent swing highs when short
- Position Sizing: Reduced size helps manage volatility around key technical levels
- Timeframe Alignment: Confirming breaks across multiple timeframes increases signal reliability
- Correlation Awareness: AUD often moves with equity markets and commodity prices
Market participants also monitor related currency pairs for confirmation. The AUD/JPY cross rate often provides early signals about risk sentiment affecting the Australian dollar. Similarly, movements in the US Dollar Index (DXY) influence all dollar pairs, including AUD/USD.
Conclusion
The AUD/USD forecast remains bearish as technical factors converge with fundamental headwinds. The critical 0.7000 support level faces repeated tests while the 200-period exponential moving average breakdown risk increases. Market participants should monitor price action around these technical levels closely, as breaks could trigger substantial follow-through movement. Ultimately, the currency pair’s direction will depend on both technical developments and evolving economic fundamentals from Australia and the United States.
FAQs
Q1: What does the 200-EMA represent in forex trading?
The 200-period exponential moving average (200-EMA) represents a long-term trend indicator that smooths price data over approximately 200 periods. Many traders consider breaks above or below this level as significant trend change signals.
Q2: Why is the 0.7000 level psychologically important for AUD/USD?
The 0.7000 level represents a major round number that often attracts attention from both retail and institutional traders. Historically, it has served as substantial support or resistance, making price action around this level particularly significant.
Q3: How do commodity prices affect the Australian dollar?
Australia exports substantial quantities of iron ore, coal, and other commodities. Therefore, price changes in these exports directly impact Australia’s trade balance and currency valuation through economic fundamentals.
Q4: What timeframes should traders monitor for confirmation of breaks?
Professional traders typically look for confirmation across multiple timeframes. A break on daily charts gains more significance when confirmed on weekly charts, while intraday breaks require daily confirmation for sustained moves.
Q5: How does US Federal Reserve policy affect AUD/USD?
The Federal Reserve’s interest rate decisions influence the US dollar’s value globally. When the Fed raises rates relative to other central banks, the dollar typically strengthens against currencies like the Australian dollar, all else being equal.
Disclaimer: The information provided is not trading advice, Bitcoinworld.co.in holds no liability for any investments made based on the information provided on this page. We strongly recommend independent research and/or consultation with a qualified professional before making any investment decisions.