Avalanche (AVAX) has been making waves in the crypto market! After a significant surge, the price is now navigating a correction phase. What’s next for AVAX? Let’s dive into the technical analysis and see what the charts are telling us.
Avalanche’s Impressive Climb
In recent days, AVAX experienced a remarkable surge, breaking through the $25 resistance zone and gaining over 50%. It even surpassed the $40 mark, reaching a multi-month high of $43.06. However, like Bitcoin and Ethereum, it faced a downside correction.
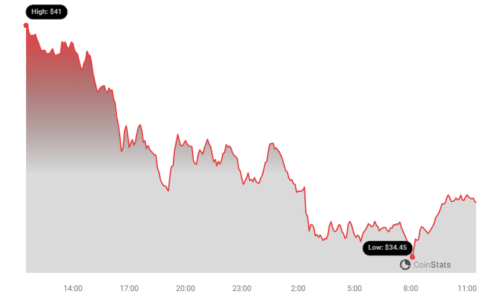
After hitting this high, a 15% drop occurred, pushing the price below $38 and the 23.6% Fib retracement level (from the $21.24 low to the $43.06 high).
Key Support and Resistance Levels
Currently, AVAX is trading above $30 and the 100-period simple moving average (4-hour chart). A bullish trend line is forming with support around $35.00. On the upside, immediate resistance lies near $38.00, with a more significant barrier at $40.00.
A successful break above $38.00 and $40.00 could trigger a 10% surge, potentially driving the price towards $45.
See Also: Will Polygon MATIC Rally On Portal Launch And FIFA NFT Deal
Dips Limited in Avalanche?
What happens if AVAX can’t maintain its upward trajectory above $38.00 or $40.00? Further downward movement is possible. Immediate support can be found near the trend line at $35.
The primary support zone is around $32.00, coinciding with the 50% Fib retracement level (from $21.24 to $43.06). A break below $32.00 could lead to a more substantial decline towards $18.80, with the next support level around $26.50 and the 100 simple moving average (4-hour chart).
Technical Indicators to Watch
- 4-hour MACD: Gaining momentum in the bearish zone.
- 4-hour RSI: Currently below the 50 level.
Key Levels to Monitor
- Major Support Levels: $35.00 and $32.00
- Major Resistance Levels: $38.00, $40.00, and $45.00
In Summary: Avalanche (AVAX) has shown considerable strength, but now faces a crucial test. Keep an eye on the key support and resistance levels outlined above. The technical indicators suggest a potential for further downside, but a break above $40 could signal a renewed bullish trend. Stay informed, trade wisely!
Disclaimer: The information provided is not trading advice, Bitcoinworld.co.in holds no liability for any investments made based on the information provided on this page. We strongly recommend independent research and/or consultation with a qualified professional before making any investment decisions.