
Bitcoin faced a slight downturn on Christmas Day, failing to sustain gains above the $44,300 resistance. After this initial stumble, BTC is currently navigating lower, with potential support expected around the $42,400 mark. Let’s delve into the factors influencing this price movement and what to anticipate next.
Bitcoin’s Christmas Day Dip: What Happened?
Bitcoin began a downside correction from the $44,300 resistance zone, dipping below $43,000 before experiencing a slight rebound. Currently, Bitcoin’s price is around $43,141.
A key declining channel is forming with support near $42,850 on the hourly chart of the BTC/USD pair (data feed from Kraken). The pair could start a fresh increase from the $42,400 support zone.
Bitcoin’s Price Action: A Closer Look
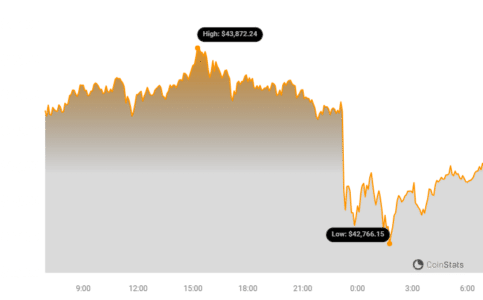
Bitcoin attempted another surge beyond the $43,500 resistance zone. BTC briefly surpassed the $44,000 level, but sellers became active near the $44,300 zone.
After forming a high near $44,300, the price initiated a new decline, falling below the $44,000 and $43,500 levels.
The price moved below the 23.6% Fib retracement level of the upward move from the $40,515 swing low to the $44,300 high.
Bitcoin is currently trading below $43,500 and the 100 hourly Simple Moving Average. A significant declining channel is also emerging, with support around $42,850 on the hourly chart of the BTC/USD pair.
See Also: Michael Novogratz Reveals The Reason Behind The Skyrocketing Price Of Bitcoin
The pair is testing the channel support, and a break below this level could trigger a further decline toward $42,400, or the 50% Fib retracement level of the upward move from $40,515 to $44,300. Should bulls defend the channel support, a fresh increase is possible.
Immediate upside resistance lies near $43,500. The primary resistance is around $44,000 and $44,300.
A successful break above $44,300 could initiate a strong rally, potentially pushing the price past $45,000.
The next key resistance is near $46,500, above which BTC could target $47,200. Further gains could propel the price towards $48,000.
Could Bitcoin Face Further Declines?
If Bitcoin fails to overcome the $43,500 resistance zone, it may continue its downward trajectory. Immediate support on the downside is near the $42,800 level.
The next major support is around $42,400. A break below this level increases the risk of further losses, potentially driving the price toward the $41,200 support in the short term.
Key Technical Indicators to Watch
- Hourly MACD: The MACD is gaining momentum in the bearish zone.
- Hourly RSI (Relative Strength Index): The RSI for BTC/USD is below the 50 level.
- Major Support Levels: $42,400, followed by $41,200.
- Major Resistance Levels: $43,500, $44,300, and $45,000.
Disclaimer: The information provided is not trading advice. Bitcoinworld.co.in holds no liability for any investments made based on the information provided on this page. We strongly recommend independent research and/or consultation with a qualified professional before making any investment decisions.
Disclaimer: The information provided is not trading advice, Bitcoinworld.co.in holds no liability for any investments made based on the information provided on this page. We strongly recommend independent research and/or consultation with a qualified professional before making any investment decisions.