

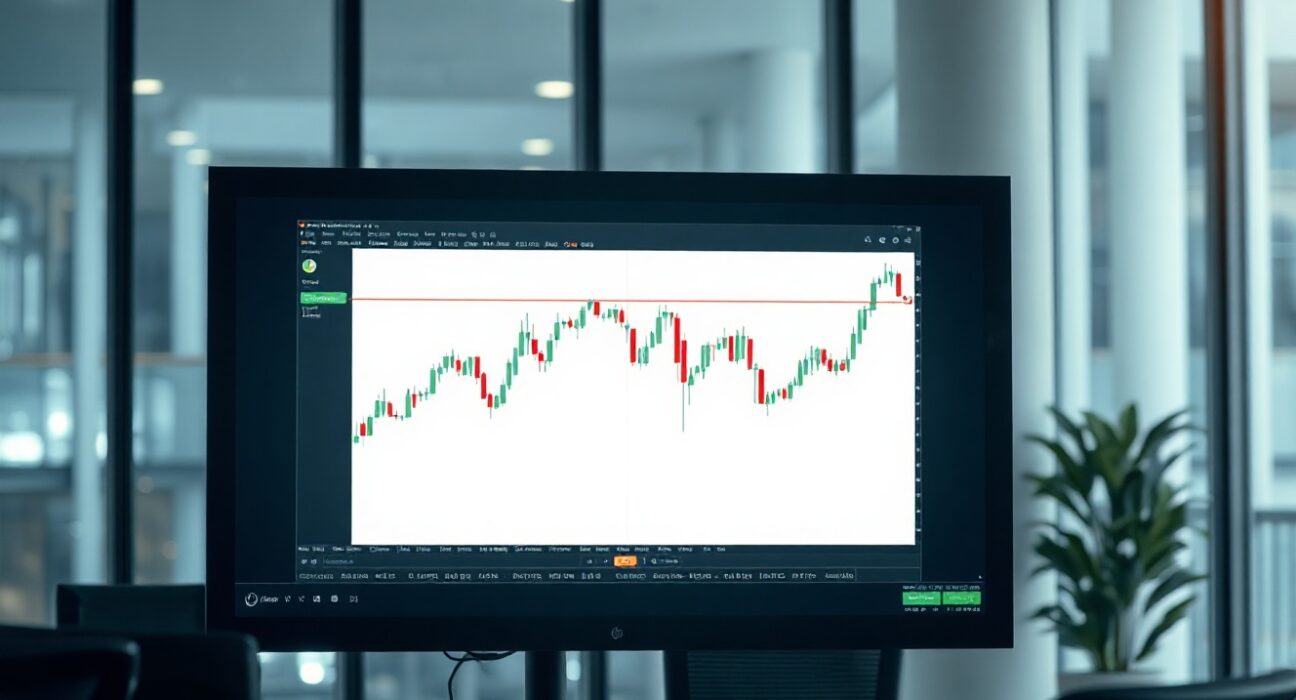
Bitcoin may be forming a bullish inverse head and shoulders pattern, a technical chart formation that often signals a potential trend reversal from bearish to bullish, according to a recent video analysis.
What is the inverse head and shoulders pattern?
The inverse head and shoulders is a well-known technical analysis pattern used by traders to identify potential bottoms in an asset’s price. It consists of three troughs: a left shoulder, a deeper head, and a right shoulder, with a common resistance level called the neckline. When the price breaks above the neckline, it is often interpreted as a bullish signal.
In Bitcoin’s case, the pattern suggests that selling pressure may be exhausting, and buyers could be stepping in to push the price higher. However, the pattern is only confirmed after a decisive break above the neckline, which has not yet occurred as of the latest analysis.
What does this mean for Bitcoin’s price?
If the inverse head and shoulders pattern completes, traders often project a price target by measuring the distance from the head’s low to the neckline and adding that to the breakout point. This could imply a significant upside move, though such projections are not guaranteed and depend on broader market conditions.
The video analysis likely highlights key support and resistance levels, as well as volume trends, to assess the strength of the pattern. As with any technical indicator, the inverse head and shoulders is not foolproof and should be considered alongside other factors such as market sentiment, macroeconomic news, and on-chain data.
Why this matters for crypto investors
For investors and traders, recognizing a potential bullish pattern can inform entry and exit decisions. However, relying solely on chart patterns can be risky, especially in the highly volatile cryptocurrency market. It is essential to combine technical analysis with fundamental research and risk management strategies.
The broader crypto market has been influenced by regulatory developments, macroeconomic trends, and institutional adoption, all of which can override technical signals. Therefore, while the inverse head and shoulders pattern is a noteworthy observation, it should be viewed as one piece of a larger analytical puzzle.
Conclusion
Bitcoin’s potential inverse head and shoulders pattern is an interesting development for technical traders, but it remains unconfirmed until a clear breakout occurs. As always, investors should exercise caution and conduct their own research before making any trading decisions.
FAQs
Q1: What is an inverse head and shoulders pattern?
An inverse head and shoulders is a bullish reversal chart pattern characterized by three troughs, with the middle one being the lowest. A breakout above the neckline confirms the pattern and suggests a potential upward move.
Q2: Is the inverse head and shoulders pattern reliable?
While it is one of the more reliable chart patterns, it is not infallible. False breakouts can occur, so traders often wait for a close above the neckline on higher-than-average volume to confirm the signal.
Q3: How do I trade the inverse head and shoulders pattern?
Traders typically enter a long position after the price breaks above the neckline, with a stop-loss below the right shoulder or the head. The profit target is often calculated by adding the height of the pattern to the breakout point.
Disclaimer: The information provided is not trading advice, Bitcoinworld.co.in holds no liability for any investments made based on the information provided on this page. We strongly recommend independent research and/or consultation with a qualified professional before making any investment decisions.
